
June 23, 2026 a 05:15 am

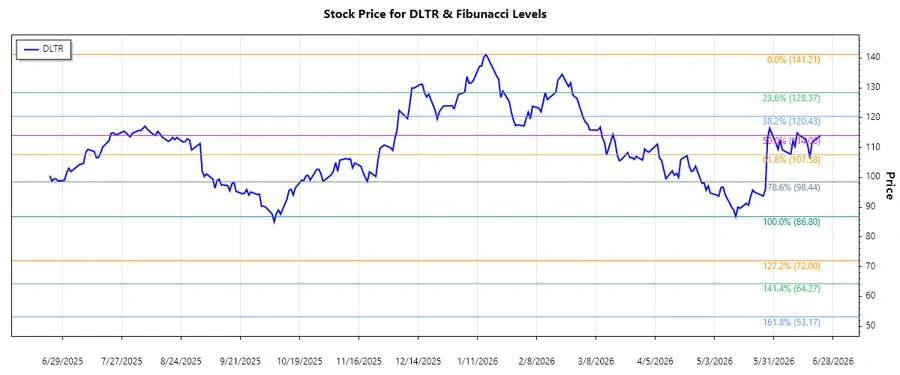
DLTR: Fibonacci Analysis - Dollar Tree, Inc.
The Dollar Tree, Inc. (DLTR) has shown varied performance patterns. Recent analyses reflect a predominantly downward trend from early 2026 into mid-2026. Investors are closely monitoring potential support and resistance levels as gleaned from Fibonacci retracement. The company's expansive operations through its Dollar Tree and Family Dollar segments continue to maintain strong retail presences across the U.S. and Canada.
Fibonacci Analysis
| Details | Information |
|---|---|
| Trend Start Date | 2026-01-14 |
| Trend End Date | 2026-05-15 |
| High Point (Price and Date) | $141.21 on 2026-01-15 |
| Low Point (Price and Date) | $86.8 on 2026-05-13 |
| 0.236 Retracement Level | $100.83 |
| 0.382 Retracement Level | $107.42 |
| 0.5 Retracement Level | $114.01 |
| 0.618 Retracement Level | $120.60 |
| 0.786 Retracement Level | $129.00 |
| Current Retracement Zone | None |
| Interpretation | The current price of $113.93 as of June 22, 2026, suggests potential resistance around the 0.5 level. Further monitoring is needed for any upward breakouts beyond this threshold. |
Conclusion
Dollar Tree, Inc.'s current technical setup highlights potential resistance as it approaches various retracement levels. While a decline was noted in the critical first half of 2026, the stock has shown some stabilization near its calculated supports. Investors should be prudently optimistic, keeping an eye on volume indicators and broader market conditions. Any breaks above the 0.5 retracement could signal further bullish momentum, while a dip below 0.786 would caution continued bearish pressure. Analysts may explore the implications of seasonal retail dynamics and consumer spending behaviors on Dollar Tree’s outlook. The company's extensive retail footprint strengthens its ability to adapt to economic variances.
Smart Data Insight
Master the Perfect Entry & Exit for this Stock
Don't leave your profits to chance. Historically, this stock follows specific seasonal patterns that institutional traders use to maximize returns.
- ✅ Identify the "Golden Buying Window"
- ✅ Avoid high-risk correction cycles
- ✅ Backtested data from the last 20+ years