November 13, 2025 a 11:45 am

DLTR: Fibonacci Analysis - Dollar Tree, Inc.
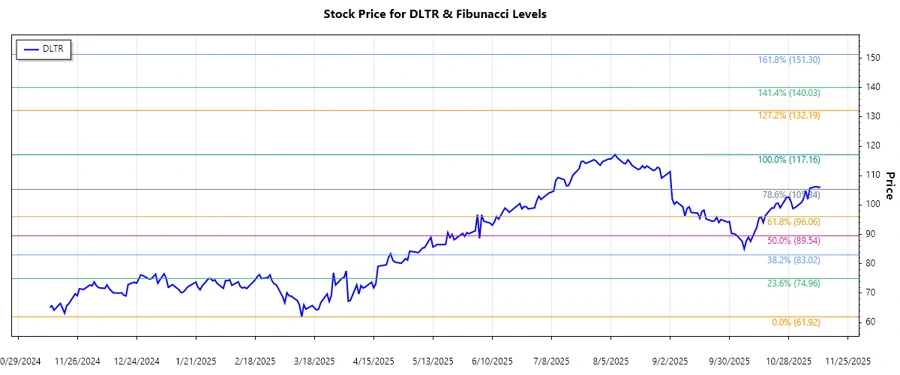
The recent price movements of Dollar Tree, Inc. (DLTR) reflect a bullish trend, recovering from its lows earlier this year. While the stock showed fluctuations, recent market resilience indicates investor confidence. Given rising consumer attention towards value-oriented retail, DLTR stands to benefit. Nevertheless, market volatility and economic headwinds remain challenges. This analysis will explore the current technical posture using Fibonacci levels to evaluate potential support and resistance.
Fibonacci Analysis
| Data Point | Value |
|---|---|
| Start Date of Trend | 2024-11-13 |
| End Date of Trend | 2025-11-12 |
| High Price and Date | $117.16 on 2025-08-07 |
| Low Price and Date | $61.92 on 2025-03-12 |
| Fibonacci Level | Price Level |
|---|---|
| 0.236 | $75.94 |
| 0.382 | $83.42 |
| 0.5 | $89.54 |
| 0.618 | $95.67 |
| 0.786 | $104.03 |
The current stock price as of November 12, 2025, is $106.18, residing above the 0.786 retracement level. This suggests the stock has likely breached a key resistance level, indicating potential upward momentum continuation. Should the price hold above this level, it's indicative of strong buyer confidence. Technical patterns suggest support around $104.03 with potential to rise further if the upward trend sustains.
Conclusion
Dollar Tree, Inc.'s (DLTR) stock demonstrates a significant recovery, having navigated through previous market fluctuations with bullish progress. The critical breach above the 0.786 Fibonacci level denotes a strong market inclination to maintain upward expansion. However, macroeconomic uncertainties and market volatilities necessitate caution. Analysts should place emphasis on consumer trends within the discount retail space, ensuring any investment is aligned with broader industry dynamics. Despite potential risks, the positive trajectory provides a conducive environment for further capital appreciation, should conditions remain favorable.
Smart Data Insight
Master the Perfect Entry & Exit for this Stock
Don't leave your profits to chance. Historically, this stock follows specific seasonal patterns that institutional traders use to maximize returns.
- ✅ Identify the "Golden Buying Window"
- ✅ Avoid high-risk correction cycles
- ✅ Backtested data from the last 20+ years