September 19, 2025 a 08:15 am

DLR: Trend and Support & Resistance Analysis - Digital Realty Trust, Inc.
Digital Realty Trust, Inc. is a leader in offering comprehensive data center services globally. Its stock price has shown volatility over the past months, indicative of the broader market's response to data-centric growth. By analyzing recent trends and key technical levels, investors can gauge potential future movements in the stock. Understanding these factors is essential for making informed investment decisions in this complex sector.
Trend Analysis
| Date | Close Price | Trend |
|---|---|---|
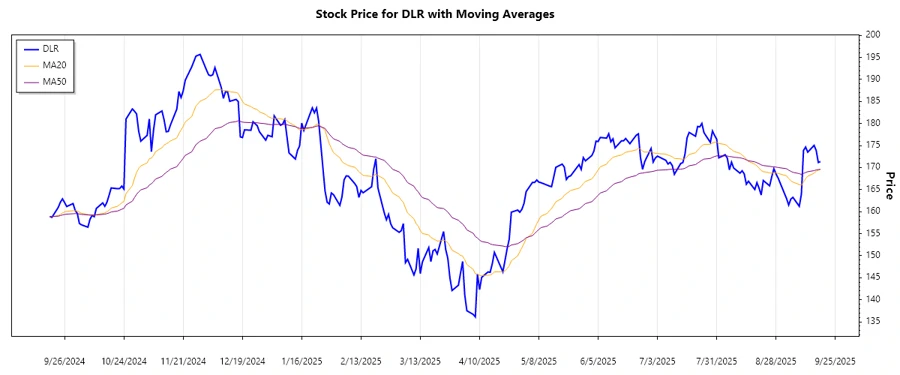
| 2025-09-18 | 171.36 | ▼ |
| 2025-09-17 | 171.15 | ▼ |
| 2025-09-16 | 173.86 | ▲ |
| 2025-09-15 | 175.04 | ▲ |
| 2025-09-12 | 173.5 | ▼ |
| 2025-09-11 | 174.67 | ▲ |
| 2025-09-10 | 173.89 | ▲ |
The EMA20 demonstrates a slight dominance over the EMA50, pointing toward a short-term upward movement. However, this should be closely monitored, as the trend could shift.
Support- and Resistance
| Zone Type | From | To |
|---|---|---|
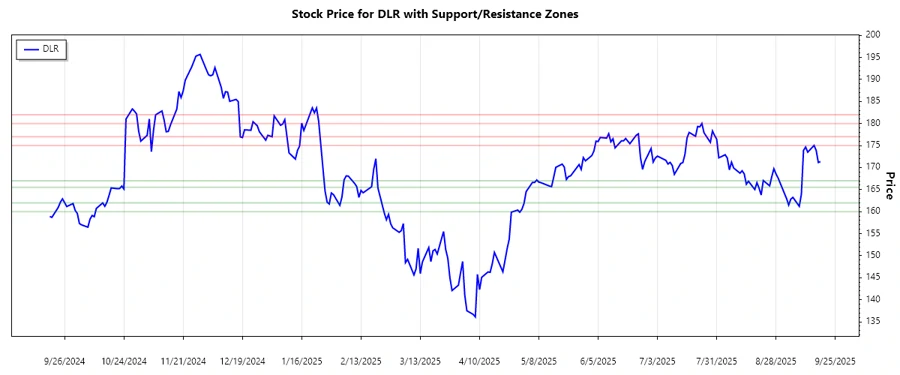
| Support 1 | 165.50 | 167.00 |
| Support 2 | 160.00 | 162.00 |
| Resistance 1 | 175.00 | 177.00 |
| Resistance 2 | 180.00 | 182.00 |
The current price level is slightly above the first support zone, suggesting it could act as a cushion in case of downward pressure.
Conclusion
The stock of Digital Realty Trust, Inc. shows indications of a slight upward trend, supported by the EMA analysis. Investors should keep an eye on the market's response to the identified support and resistance zones, as these could offer new investment opportunities. However, external market conditions and company-specific developments might still impact the stock price. Considering the company's strong position in the data center market, the stock is likely to present both growth potential and risks associated with market competition and volatility. Cautious optimism is advised for long-term investors.
Smart Data Insight
Master the Perfect Entry & Exit for this Stock
Don't leave your profits to chance. Historically, this stock follows specific seasonal patterns that institutional traders use to maximize returns.
- ✅ Identify the "Golden Buying Window"
- ✅ Avoid high-risk correction cycles
- ✅ Backtested data from the last 20+ years