August 05, 2025 a 04:44 pm

DLR: Fibonacci Analysis - Digital Realty Trust, Inc.
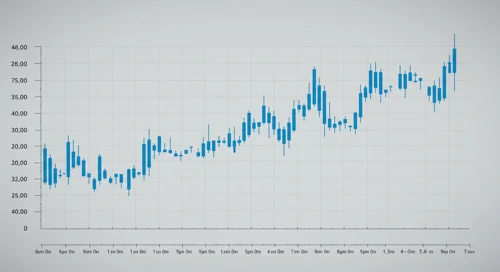
Digital Realty Trust, Inc. (DLR) has shown significant price movement over recent months. The stock is known for its role in supporting critical data infrastructure globally. Recent trends have indicated volatility, likely influencing investor sentiment and technical indicators. A detailed Fibonacci analysis provides insight into potential support and resistance levels that investors may find valuable in assessing future price movements.
Fibonacci Analysis
| Detail | Value |
|---|---|
| Trend Start Date | 2025-05-12 |
| Trend End Date | 2025-07-30 |
| High Point (Price and Date) | $180.02 on 2025-07-24 |
| Low Point (Price and Date) | $165.67 on 2025-05-14 |
| Fibonacci 0.236 Level | $169.40 |
| Fibonacci 0.382 Level | $172.10 |
| Fibonacci 0.5 Level | $172.85 |
| Fibonacci 0.618 Level | $173.60 |
| Fibonacci 0.786 Level | $175.30 |
| Current Price Retracement Zone | 0.236 |
| Technical Interpretation | The current price is in the 0.236 retracement zone, indicating a potential support area before a possible continuation of the upward trend. |
Conclusion
The analysis of Digital Realty Trust, Inc. (DLR) reveals an intriguing upward trend distinguished by fluctuating support and resistance. Opportunities lie in the stock's essential nature within the rapidly expanding data center sector, where digital infrastructure is paramount. Conversely, market volatility could drive fluctuations, posing risks to potential investors. The technical findings suggest a solid basis for the current support, but market participants should remain vigilant for trend changes. Ultimately, the interplay between market sentiment and structural growth will dictate future trajectory for DLR.