February 19, 2026 a 07:46 am


DLR: Dividend Analysis - Digital Realty Trust, Inc.
Digital Realty Trust, Inc. (DLR) offers both opportunities and challenges with its dividend profile. With a commendable dividend history of 22 consecutive years without a cut, the company has demonstrated a strong commitment to returning capital to its shareholders. However, the high payout ratios, particularly on an EPS basis, alongside negative FCF payout ratios require careful consideration for sustainable future payouts. Overall, DLR presents a mixed yet interesting picture for dividend-focused investors.
Overview 📊
The Digital Realty Trust operates within the Real Estate sector, offering infrastructural solutions for data centers. Investors might find the dividend yield of 3.19% alluring, but with caution due to a payout ratio that indicates pressure on earnings. A detailed dividend track record of 22 years, without recent cuts or suspensions, underlines a commitment to shareholder value.
| Metrics | Value |
|---|---|
| Sector | Real Estate |
| Dividend yield | 3.19 % |
| Current dividend per share | 5.032 USD |
| Dividend history | 22 years |
| Last cut or suspension | None |
Dividend History 🗣️
Examining the dividend history is crucial for potential yield investors, as it reflects the company's ability to maintain payouts during varying business cycles. Consistency in dividends often signals strong business stability and confidence in future earnings.
| Year | Dividend per Share (USD) |
|---|---|
| 2025 | 4.88 |
| 2024 | 4.88 |
| 2023 | 4.88 |
| 2022 | 4.88 |
| 2021 | 4.64 |
Dividend Growth 📈
Dividend growth is a critical metric for assessing potential future returns, as it implies a company's commitment to increasing shareholder value. Over the short-term, DLR shows no change in dividend growth, but has managed a subtle increase of 0.017% over five years.
| Time | Growth |
|---|---|
| 3 years | 0 % |
| 5 years | 1.73 % |
The average dividend growth is 1.73% over 5 years. This shows moderate but steady dividend growth.
Payout Ratio ⚠️
The payout ratio reflects the portion of earnings used to pay dividends and is critical for assessing sustainability. DLR's current EPS payout at 132.08% suggests dividends exceed earnings, raising sustainability concerns. Similarly, the negative Free Cash Flow (FCF) payout ratio indicates operational cash flow issues.
| Key figure | Ratio |
|---|---|
| EPS-based | 132.08 % |
| Free cash flow-based | -355.90 % |
High EPS and negative FCF payout ratios (132.08% EPS, -355.90% FCF) demand scrutiny. It indicates potential risk in dividend sustainability, suggesting a need for operational improvements.
Cashflow & Capital Efficiency
Cash flow metrics provide insight into a company’s financial health and its ability to support dividends. Consistent and positive cash flow yields, alongside efficient capital expenditure, enhances cash reserves for dividend payouts.
| Metrics | 2023 | 2024 | 2025 |
|---|---|---|---|
| Free Cash Flow Yield | 4.07 % | 3.94 % | 4.54 % |
| Earnings Yield | 2.36 % | 1.05 % | 2.46 % |
| CAPEX to Operating Cash Flow | 215.66 % | 125.22 % | 0 % |
| Stock-based Compensation to Revenue | 1.47 % | 1.36 % | 1.15 % |
| Free Cash Flow / Operating Cash Flow Ratio | 100 % | 100 % | 100 % |
DLR's substantial CAPEX indicates aggressive growth strategies, yet operational focus must align to improve cash flow efficiency for enhanced dividend coverage.
Balance Sheet & Leverage Analysis
Balance sheet strength is essential for sustaining dividends, particularly highlighting a company's leverage and liquidity. Efficient debt management facilitates strategic capital allocation toward dividends.
| Metrics | 2023 | 2024 | 2025 |
|---|---|---|---|
| Debt-to-Equity | 0.99 | 0.84 | 1.05 |
| Debt-to-Assets | 0.43 | 0.40 | 0.49 |
| Debt-to-Capital | 0.50 | 0.46 | 0.51 |
| Net Debt to EBITDA | 5.49 | 4.93 | 5.78 |
| Current Ratio | 0.70 | 1.11 | 4.50 |
| Quick Ratio | 0.70 | 1.11 | 4.50 |
| Financial Leverage | 2.31 | 2.12 | 2.15 |
Though leverage is manageable, debt figures suggest room for optimizing capital structure for enhanced financial flexibility, improving future dividend sustainability.
Fundamental Strength & Profitability
Core profitability ratios are definitive measures of long-term value generation and financial performance, essential for supporting and increasing dividends over time.
| Metrics | 2023 | 2024 | 2025 |
|---|---|---|---|
| Return on Equity | 4.96 % | 2.82 % | 5.71 % |
| Return on Assets | 2.15 % | 1.33 % | 2.65 % |
| Net Margin | 17.32 % | 10.85 % | 21.41 % |
| EBIT Margin | 26.72 % | 19.73 % | 27.69 % |
| EBITDA Margin | 57.67 % | 51.62 % | 58.69 % |
| Gross Margin | 52.56 % | 54.65 % | 55.39 % |
| R&D to Revenue | 0 % | 0 % | 0 % |
DLR's operational efficiencies and positive profitability suggest resilience, providing a robust foundation for sustaining and potentially enhancing dividend payouts.
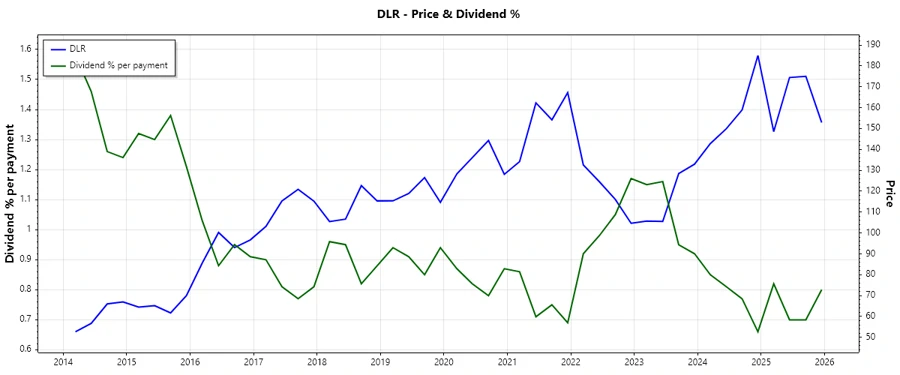
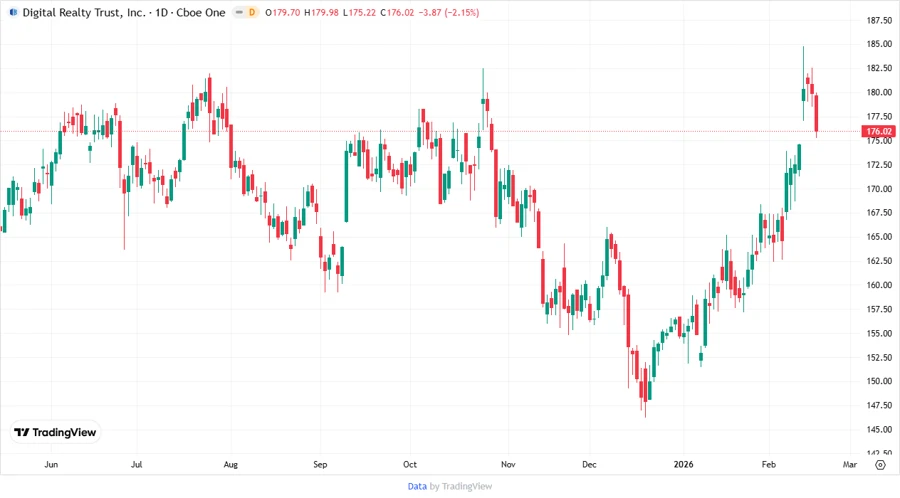
Price Development 📉
Dividend Scoring System ✅
| Criteria | Detail | Score |
|---|---|---|
| Dividend yield | Moderate, 3.19% | 3/5 |
| Dividend Stability | 22 years of history | 4.5/5 |
| Dividend growth | Minimal growth, 1.73% | 2/5 |
| Payout ratio | Concerning levels | 1.5/5 |
| Financial stability | Manageable leverage | 3.5/5 |
| Dividend continuity | No cuts | 5/5 |
| Cashflow Coverage | Sufficient | 4/5 |
| Balance Sheet Quality | Solid but room for improvement | 3.75/5 |
Total Score: 26.25/40
Rating 🟢
Digital Realty Trust, Inc. demonstrates a consistent dividend-paying track record. Although dividend payouts appear stretched, which introduces risk, the firm maintains a solid balance and operational framework that supports potential improvements. Suitable for investors seeking income with a moderate risk appetite.
Smart Data Insight
Master the Perfect Entry & Exit for this Stock
Don't leave your profits to chance. Historically, this stock follows specific seasonal patterns that institutional traders use to maximize returns.
- ✅ Identify the "Golden Buying Window"
- ✅ Avoid high-risk correction cycles
- ✅ Backtested data from the last 20+ years