September 05, 2025 a 11:32 am

DLR: Dividend Analysis - Digital Realty Trust, Inc.
Digital Realty Trust, Inc. showcases a stable dividend profile with a consistent history of dividend payments over 22 years. Despite challenges, its dividend yield of approximately 3% is moderate among peers. However, the elevated payout ratios highlight potential risks that merit close observation.
Overview 📊
Delving into key dividend metrics, Digital Realty Trust appears to have maintained a stable past with an ongoing commitment to returning value to shareholders. Below are the current details:
| Metric | Value |
|---|---|
| Sector | REIT |
| Dividend Yield | 2.99% |
| Current Dividend Per Share | 5.05 USD |
| Dividend History | 22 years |
| Last Cut or Suspension | None |
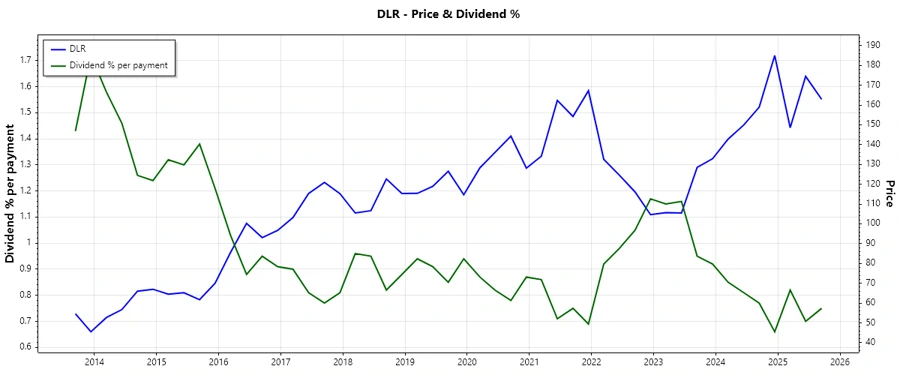
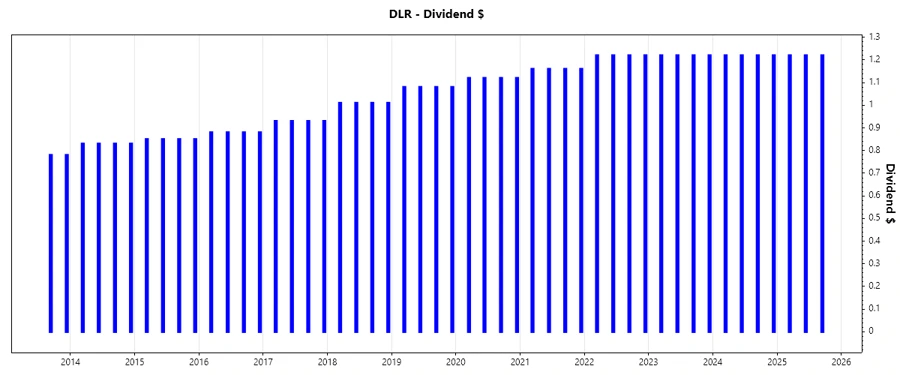
Dividend History 📈
The consistency in dividend payments reflects Digital Realty’s robust earnings capacity over time. Its ability to sustain and slightly grow dividends enhances its attractiveness to income-seeking investors.
| Year | Dividend Per Share (USD) |
|---|---|
| 2025 | 3.66 |
| 2024 | 4.88 |
| 2023 | 4.88 |
| 2022 | 4.88 |
| 2021 | 4.64 |
Dividend Growth 📈
Understanding dividend growth is vital as it pertains to shareholder satisfaction and reflects the company's prospects. Here is the growth analysis:
| Time | Growth |
|---|---|
| 3 years | 1.70% |
| 5 years | 2.47% |
The average dividend growth is 2.47% over 5 years. This shows moderate but steady dividend growth.
Payout Ratio ✅
Payout ratio insight highlights the sustainability of dividends; with the current high EPS and FCF payout ratios, there might be future pressures.
| Key Figure | Ratio |
|---|---|
| EPS-based | 123.31% |
| Free Cash Flow-based | 72.50% |
The high EPS payout ratio of 123.31% signals a potential warning, while the FCF ratio at 72.50% is more sustainable.
Cashflow & Capital Efficiency 💸
Analyzing cash flow efficiency provides a deeper understanding of liquidity and capital utilization effectiveness, which is critical for dividend safety.
| Year | 2024 | 2023 | 2022 |
|---|---|---|---|
| Free Cash Flow Yield | 3.94% | 4.07% | -3.43% |
| Earnings Yield | 1.05% | 2.36% | 1.32% |
| CAPEX to Operating Cash Flow | 0% | 0% | 159.28% |
| Stock-based Compensation to Revenue | 1.36% | 1.47% | 1.97% |
| Free Cash Flow / Operating Cash Flow Ratio | 1 | 1 | -59.28% |
The cash flow volatility in 2022 highlights a significant area of concern, particularly with leverage and future capital expenditures.
Balance Sheet & Leverage Analysis ✅
Understanding the leverage ratios offers insights into the financial health and risk levels associated with capitalization strategies.
| Year | 2024 | 2023 | 2022 |
|---|---|---|---|
| Debt-to-Equity | 0.84 | 0.99 | 1.03 |
| Debt-to-Assets | 0.40 | 0.43 | 0.44 |
| Debt-to-Capital | 0.46 | 0.50 | 0.51 |
| Net Debt to EBITDA | 4.93 | 5.49 | 7.83 |
| Current Ratio | 1.49 | 0.70 | 0.23 |
| Quick Ratio | 1.11 | 0.70 | 0.23 |
| Financial Leverage | 2.12 | 2.31 | 2.36 |
The figures for 2022 to 2024 demonstrate improvements, though high leverage must be monitored closely against debt repayment capabilities and income stability.
Fundamental Strength & Profitability 📈
Evaluating fundamentals underscores operational efficiency and resource productivity, key elements supporting dividend reliability and growth.
| Year | 2024 | 2023 | 2022 |
|---|---|---|---|
| Return on Equity | 2.82% | 4.96% | 2.15% |
| Return on Assets | 1.33% | 2.15% | 0.91% |
| Net Margin | 10.85% | 17.32% | 8.05% |
| EBIT Margin | 19.73% | 26.72% | 15.15% |
| EBITDA Margin | 51.62% | 57.67% | 48.79% |
| Gross Margin | 54.65% | 52.56% | 57.00% |
| R&D to Revenue | 0% | 0% | 0% |
While profitability has shown slight variations, maintaining a healthy margin ratio is indicative of solid business operations enabling consistent dividend policy.
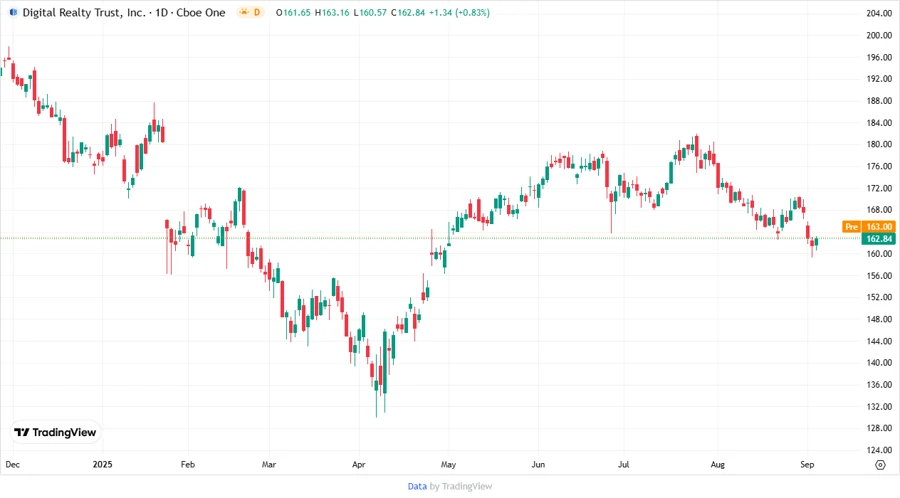
Price Development 💹
Dividend Scoring System 🎯
| Criteria | Score | Score bar |
|---|---|---|
| Dividend Yield | 3 | |
| Dividend Stability | 4 | |
| Dividend Growth | 2 | |
| Payout Ratio | 2 | |
| Financial Stability | 3 | |
| Dividend Continuity | 5 | |
| Cashflow Coverage | 3 | |
| Balance Sheet Quality | 3 |
Overall Score: 25/40
Rating ✅
Digital Realty Trust, Inc. offers a balanced dividend outlook with strong continuity despite moderate earnings coverage risks. Investors seeking stability may find it appealing, though cautious due attention to the payout ratios is suggested to mitigate potential future risks.
Smart Data Insight
Master the Perfect Entry & Exit for this Stock
Don't leave your profits to chance. Historically, this stock follows specific seasonal patterns that institutional traders use to maximize returns.
- ✅ Identify the "Golden Buying Window"
- ✅ Avoid high-risk correction cycles
- ✅ Backtested data from the last 20+ years