
October 22, 2025 a 03:15 pm
DIS: Fibonacci Analysis - The Walt Disney Company
The Walt Disney Company is a prominent player in the entertainment industry, renowned for its diverse portfolio ranging from iconic theme parks to successful streaming platforms like Disney+. The company's stock has recently demonstrated a prominent downtrend, raising concerns among investors. With recent fluctuations in its price, understanding the potential retracement levels is crucial for informed decision-making.
Fibonacci Analysis
| Start Date | End Date | High Price | Low Price | Current Price |
|---|---|---|---|---|
| 2024-12-02 | 2025-10-06 | $124.00 (2025-07-03) | $84.00 (2025-04-21) | $114.095 (2025-10-22) |
Fibonacci Levels
| Retracement Level | Price Level |
|---|---|
| 0.236 | $93.44 |
| 0.382 | $101.45 |
| 0.5 | $104.00 |
| 0.618 | $106.55 |
| 0.786 | $111.52 |
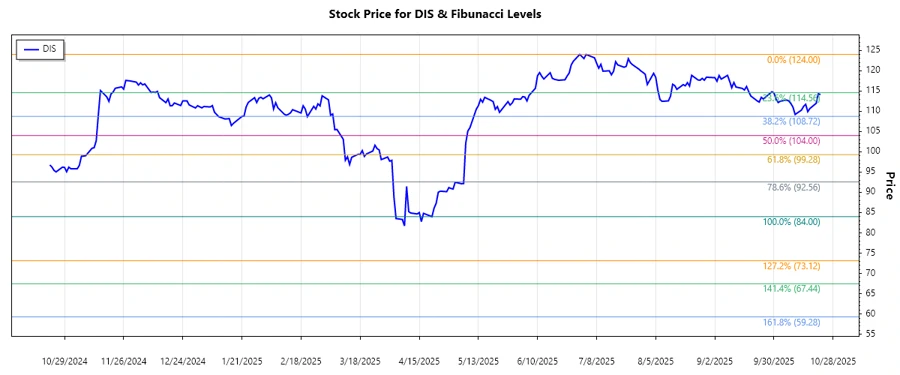
The current price of $114.095 is above the 0.786 retracement level, indicating a potential resistance area.
With the current price position, this suggests a possible resistance, indicating investors may see selling pressure in the near term.
The chart above shows the trend and Fibonacci levels.
Conclusion
While the stock is currently trading above the 0.786 retracement level, indicating potential resistance, investors should be cautious. The downtrend suggests bearish sentiment, albeit with potential for rebounds. Further upside momentum might meet resistance, and careful observation of market conditions is necessary. Analysts could consider this retracement level as a point of potential selling activity. The overall outlook depends heavily on broader market conditions and investor sentiment towards the entertainment sector. Long-term prospects remain tied to Disney's strategic initiatives.
Smart Data Insight
Master the Perfect Entry & Exit for this Stock
Don't leave your profits to chance. Historically, this stock follows specific seasonal patterns that institutional traders use to maximize returns.
- ✅ Identify the "Golden Buying Window"
- ✅ Avoid high-risk correction cycles
- ✅ Backtested data from the last 20+ years