February 12, 2026 a 11:31 am

DIS: Dividend Analysis - The Walt Disney Company
📊 The Walt Disney Company, a leading media and entertainment conglomerate, presents an intriguing dividend profile, albeit with recent challenges. The company's established legacy of dividend payments is overshadowed by negative dividend growth in recent years. Its payout ratios suggest a conservative approach, but certain financial metrics indicate areas of caution.
Overview
📈 Disney operates in the communication services sector, a domain known for its media reach and entertainment influence. Its current dividend yield is 1.39%, with a dividend per share of approximately $1.00. Impressively, Disney has maintained a 42-year history without formally cutting or suspending its dividends.
| Metric | Value |
|---|---|
| Sector | Communication Services |
| Dividend Yield | 1.39% |
| Current Dividend Per Share | 0.999 USD |
| Dividend History | 42 years |
| Last Cut or Suspension | None |
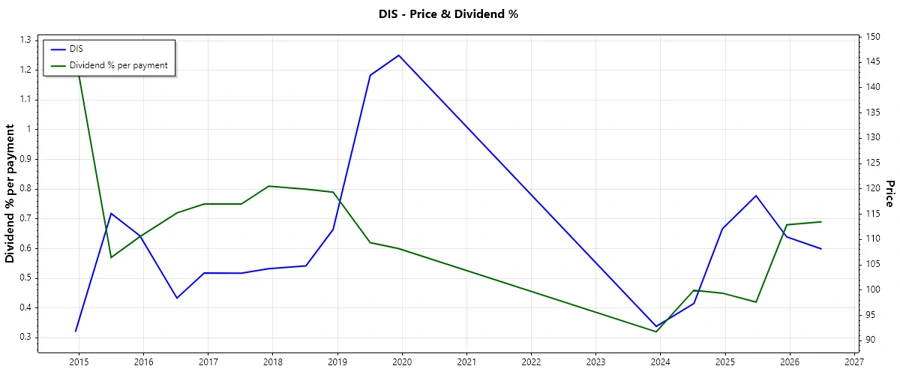
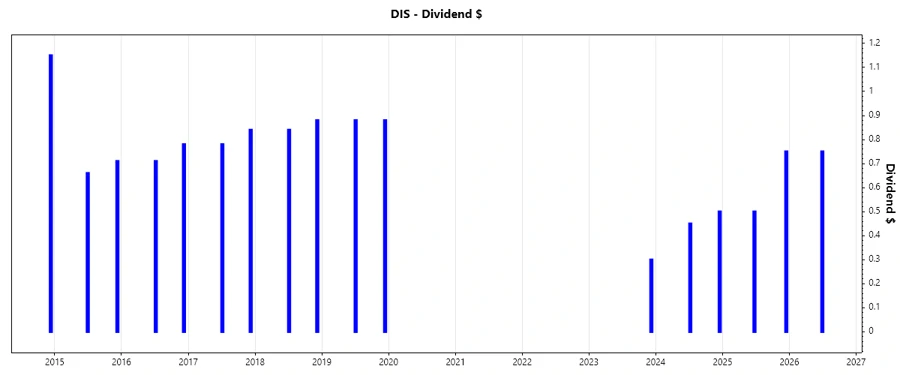
Dividend History
📉 Historically, Disney's dividends have demonstrated resilience despite market shifts. Monitoring these trends provides insights into the company's ability to deliver consistent shareholder value.
| Year | Dividend Per Share (USD) |
|---|---|
| 2026 | 0.75 |
| 2025 | 1.25 |
| 2024 | 0.95 |
| 2023 | 0.30 |
| 2019 | 1.76 |
Dividend Growth
🗣️ Understanding dividend growth is crucial. Negative dividend growth over 3 and 5 years raises questions on sustainability.
| Time | Growth |
|---|---|
| 3 years | -10.78% |
| 5 years | -6.61% |
⚠️ The average dividend growth is -6.61% over 5 years. This shows moderate but steady dividend decline, reflecting the company's strategic fiscal adjustments.
Payout Ratio
🗣️ Payout ratios are a strong indicator of financial health, reflecting a company’s dividend sustainability.
| Key Figure | Ratio |
|---|---|
| EPS-based | 14.57% |
| Free Cash Flow-based | 25.10% |
✅ Disney maintains prudent payout ratios of 14.57% (EPS) and 25.10% (FCF), suggesting strong dividend coverage and potential for future increases.
Cashflow & Capital Efficiency
📊 Cashflow efficiency and capital utilization are key financial metrics that reflect operational competence and financial health.
| 2023 | 2024 | 2025 | |
|---|---|---|---|
| Free Cash Flow Yield | 3.31% | 4.88% | 4.92% |
| Earnings Yield | 1.59% | 2.84% | 6.06% |
| CAPEX to Operating Cash Flow | 50.36% | 38.74% | 44.33% |
| Stock-based Compensation to Revenue | 1.29% | 1.50% | 1.44% |
| Free Cash Flow / Operating Cash Flow Ratio | 49.64% | 61.26% | 55.67% |
✅ While Disney shows respectable earnings yield and efficient capital allocation, the stock-based compensation and CAPEX ratios indicate areas for optimization.
Balance Sheet & Leverage Analysis
📉 Understanding leverage and balance sheet robustness is essential for assessing long-term financial stability.
| 2023 | 2024 | 2025 | |
|---|---|---|---|
| Debt-to-Equity | 51.04% | 49.17% | 40.85% |
| Debt-to-Assets | 24.65% | 25.24% | 22.72% |
| Debt-to-Capital | 33.79% | 32.96% | 29.00% |
| Net Debt to EBITDA | 3.01 | 2.97 | 2.05 |
| Current Ratio | 1.05 | 0.73 | 0.71 |
| Quick Ratio | 0.99 | 0.67 | 0.65 |
| Financial Leverage | 2.07 | 1.95 | 1.80 |
⚠️ While financial leverage is manageable, liquidity metrics indicate room for strengthening to resist potential downturns.
Fundamental Strength & Profitability
📲 Profitability metrics are central to the company's valuation and competitiveness.
| 2023 | 2024 | 2025 | |
|---|---|---|---|
| Return on Equity | 2.37% | 4.94% | 11.29% |
| Return on Assets | 1.15% | 2.53% | 6.28% |
| Margins: Net | 2.65% | 5.44% | 13.14% |
| Margins: EBIT | 7.58% | 10.55% | 14.63% |
| Margins: EBITDA | 13.62% | 16.01% | 20.27% |
| Margins: Gross | 33.41% | 35.75% | 37.76% |
| Research & Development to Revenue | 0% | 0% | 0% |
✅ Disney exhibits a solid return on equity with improving profitability margins, reflecting its competitive position despite market challenges.
Price Development
Dividend Scoring System
| Criteria | Score | Score Bar |
|---|---|---|
| Dividend yield | 4 | |
| Dividend Stability | 5 | |
| Dividend growth | 2 | |
| Payout ratio | 5 | |
| Financial stability | 3 | |
| Dividend continuity | 5 | |
| Cashflow Coverage | 4 | |
| Balance Sheet Quality | 3 |
Overall Score: 31/40
Rating
✅ With a robust dividend history and prudent payout strategy, The Walt Disney Company presents an attractive profile for dividend-focused investors. However, potential investors should be mindful of recent negative dividend growth and industry challenges that might impact future returns. Strategic monitoring of financial metrics is advised for long-term investment decisions.