October 05, 2025 a 11:32 am

DIS: Dividend Analysis - The Walt Disney Company
The Walt Disney Company stands out in the entertainment sector with a rich history of 41 years of dividend payments. While recent dividend growth has been negative, the company still holds a significant position in the market with over $202 billion in market capitalization. Investors may need to weigh the historic continuity of dividends against current financial challenges when considering Disney for dividend income.
Overview 📊
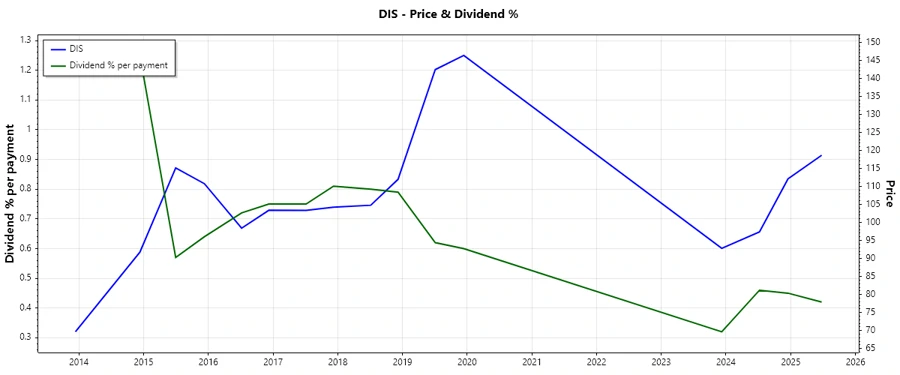
With its roots deeply embedded in the entertainment sector, Disney has maintained a minimal but consistent dividend yield of 0.84%. Despite recent challenges, the company has shown resilience in maintaining investor payouts over several decades.
| Aspect | Details |
|---|---|
| Sector | Entertainment |
| Dividend yield | 0.84 % |
| Current dividend per share | 0.75 USD |
| Dividend history | 41 years |
| Last cut or suspension | None |
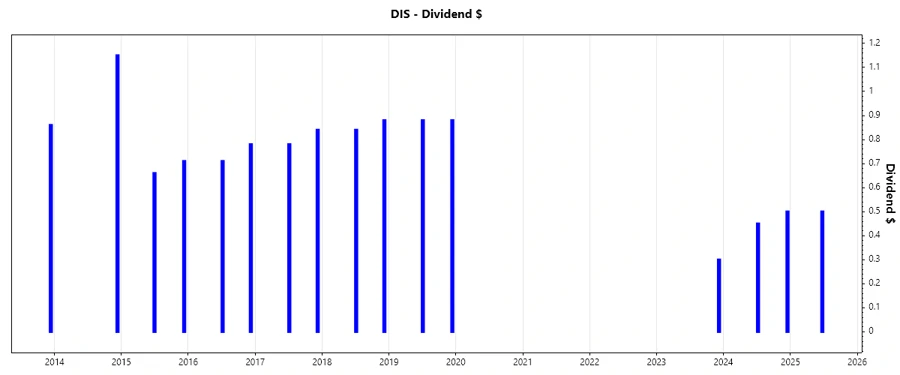
Dividend History 🗣️
The significance of dividend history cannot be overstated, as it provides a tangible proof of a company's commitment to returning value to shareholders. Disney's ability to maintain dividends for more than four decades showcases its dedication to this cause.
| Year | Dividend per Share (USD) |
|---|---|
| 2025 | 0.50 |
| 2024 | 0.95 |
| 2023 | 0.30 |
| 2019 | 1.76 |
| 2018 | 1.72 |
Dividend Growth 📈
Dividend growth is a critical measure of a company's potential to increase shareholder value over time. Despite recent declines in growth, Disney’s historical ability to enhance its payouts reflects the company's previous financial strength and market positioning.
| Time | Growth |
|---|---|
| 3 years | -18.58 % |
| 5 years | -11.60 % |
The average dividend growth is -11.60% over 5 years. This indicates challenges in maintaining dividend increases but suggests a possible recalibration of strategic priorities to stabilize growth.
Payout Ratio ✅
Evaluating payout ratios is crucial in assessing the sustainability of a company’s dividend policy. With Disney's EPS-based payout ratio at 11.66% and FCF-based ratio at 11.65%, it indicates a conservative approach with ample capacity to cover dividend obligations from both earnings and cash flow perspectives.
| Key figure | Ratio |
|---|---|
| EPS-based | 11.66 % |
| Free cash flow-based | 11.65 % |
These low payout ratios suggest Disney has wisely managed its dividend obligations, leaving room for growth or operational reinvestment.
Cashflow & Capital Efficiency ⚠️
Cash flow indicators offer insights into a company’s operational efficiency and its ability to meet its financial commitments. For Disney, strong cash flow figures alongside strategic capital expenditures reflect disciplined financial management and investment into growth areas.
| Fiscal Year | 2024 | 2023 | 2022 |
|---|---|---|---|
| Free Cash Flow Yield | 4.88% | 3.31% | 0.62% |
| Earnings Yield | 2.84% | 1.59% | 1.83% |
| CAPEX to Operating Cash Flow | 39.68% | 50.36% | 82.25% |
| Stock-based Compensation to Revenue | 1.50% | 1.29% | 1.18% |
| Free Cash Flow / Operating Cash Flow Ratio | 61.26% | 49.64% | 17.75% |
| Return on Invested Capital | 5.37% | 3.56% | 2.55% |
Disney’s capital efficiency, highlighted by its CAPEX strategy and free cash flow conversion, underscores an effective balance between expansion and profitability, critical for future dividend reliability.
Balance Sheet & Leverage Analysis 📉
A robust balance sheet underpins a company’s ability to handle economic fluctuations. Disney's leverage ratios remain within manageable limits, which bodes well for continuous financial stability and dividend reliability.
| Fiscal Year | 2024 | 2023 | 2022 |
|---|---|---|---|
| Debt-to-Equity | 49.17% | 51.04% | 55.00% |
| Debt-to-Assets | 25.24% | 24.65% | 25.66% |
| Debt-to-Capital | 32.96% | 33.79% | 35.49% |
| Net Debt to EBITDA | 2.97 | 3.01 | 3.39 |
| Current Ratio | 0.67 | 1.05 | 1.00 |
| Quick Ratio | 0.67 | 0.99 | 0.94 |
| Financial Leverage | 1.95 | 2.07 | 2.14 |
Despite an increase in leverage, Disney's ability to cover its obligations suggests potential for maintaining stable dividend payments, assuring investors of ongoing fiscal responsibility.
Fundamental Strength & Profitability 📉
Profitability metrics provide an overview of a company’s operational success. Disney’s returns and margins reflect its ongoing efforts to enhance efficiency while sustaining profitability.
| Fiscal Year | 2024 | 2023 | 2022 |
|---|---|---|---|
| Return on Equity | 4.94% | 2.37% | 3.31% |
| Return on Assets | 2.53% | 1.15% | 1.54% |
| Net Margin | 5.44% | 2.65% | 3.80% |
| EBIT Margin | 10.55% | 7.58% | 8.26% |
| EBITDA Margin | 16.01% | 13.62% | 14.50% |
| Gross Margin | 35.75% | 33.41% | 34.24% |
| R&D to Revenue | 0.00% | 0.00% | 0.00% |
Disney's profitability performance reveals positive traction, with profitability ratios demonstrating efforts towards financial fortification. However, strategic innovation remains key, as R&D investment is currently minimal.
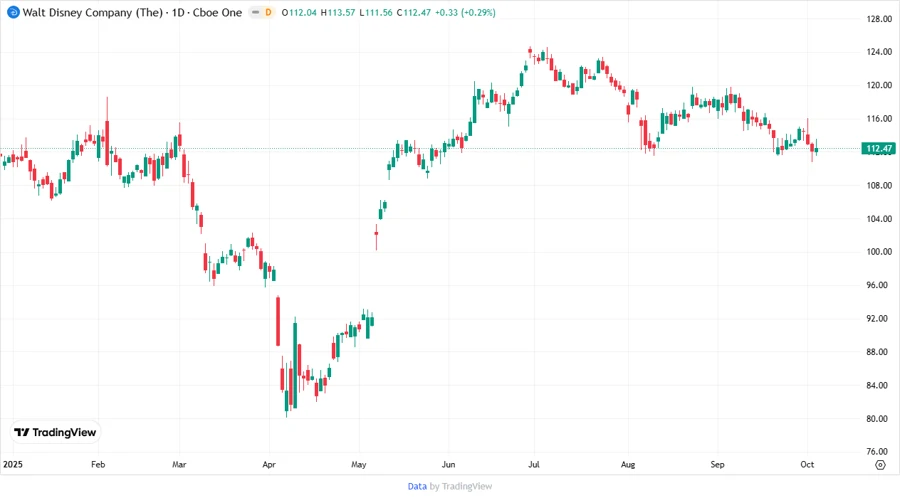
Price Development
Dividend Scoring System 📈
| Category | Score | Score Bar |
|---|---|---|
| Dividend yield | 3 | |
| Dividend Stability | 4 | |
| Dividend growth | 2 | |
| Payout ratio | 5 | |
| Financial stability | 4 | |
| Dividend continuity | 4 | |
| Cashflow Coverage | 4 | |
| Balance Sheet Quality | 3 |
Total Score: 29/40
Rating ⭐
Disney remains a resilient player with a commitment to shareholder returns, although recent headwinds have impacted its dividend momentum. With sound financial management, Disney continues to offer potential but investors should remain cautious and monitor future developments.
Smart Data Insight
Master the Perfect Entry & Exit for this Stock
Don't leave your profits to chance. Historically, this stock follows specific seasonal patterns that institutional traders use to maximize returns.
- ✅ Identify the "Golden Buying Window"
- ✅ Avoid high-risk correction cycles
- ✅ Backtested data from the last 20+ years