November 07, 2025 a 11:45 am
DHR: Fibonacci Analysis - Danaher Corporation
Danaher Corporation, a well-diversified global player in the life sciences and diagnostics sectors, has seen significant market movements. With its robust presence across multiple high-growth industries, the stock continues to attract attention from investors. Recent data highlights a notable downtrend in its stock price, suggesting potential opportunities for value-seeking investors as the market evaluates its long-term growth prospects.
Fibonacci Analysis
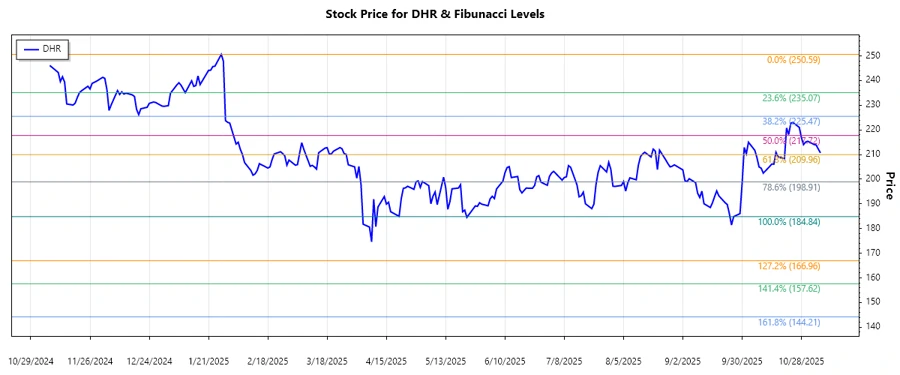
The analysis focuses on a dominant downtrend observed from 2025-01-27 to 2025-10-27. Here's a detailed breakdown of the trend and the calculated Fibonacci levels.
| Start Date | End Date | High (Price/Date) | Low (Price/Date) | Fibonacci Levels | Current Price | Retracement Zone | Interpretation |
|---|---|---|---|---|---|---|---|
| 2025-01-27 | 2025-10-27 | $250.59 / 2025-01-27 | $184.84 / 2025-09-26 |
|
$210.67 | 0.382 | The current price of $210.67 is within the 0.382 retracement level, indicating a potential resistance zone for the stock price in the near term. |
This suggests that the current price is experiencing resistance at the 0.382 level, which could act as a hurdle for further upward movement. If the price manages to overcome this level, it could move towards the 0.5 and 0.618 levels, which are potential next resistance points.
Conclusion
The Danaher Corporation stock is currently exhibiting signs of potential technical bounce-back from a significant downtrend. While the 0.382 Fibonacci retracement level presents immediate resistance, a breakthrough could lead to further upside. However, failure to sustain above this level could result in further downside testing. Investors may observe these levels for critical points of support and resistance as they evaluate the company's growth trajectory across its diverse business segments. As such, the Fibonacci analysis provides valuable insight into potential price actions and key price levels for market participants.
Smart Data Insight
Master the Perfect Entry & Exit for this Stock
Don't leave your profits to chance. Historically, this stock follows specific seasonal patterns that institutional traders use to maximize returns.
- ✅ Identify the "Golden Buying Window"
- ✅ Avoid high-risk correction cycles
- ✅ Backtested data from the last 20+ years