September 25, 2025 a 11:44 am
DHR: Fibonacci Analysis - Danaher Corporation
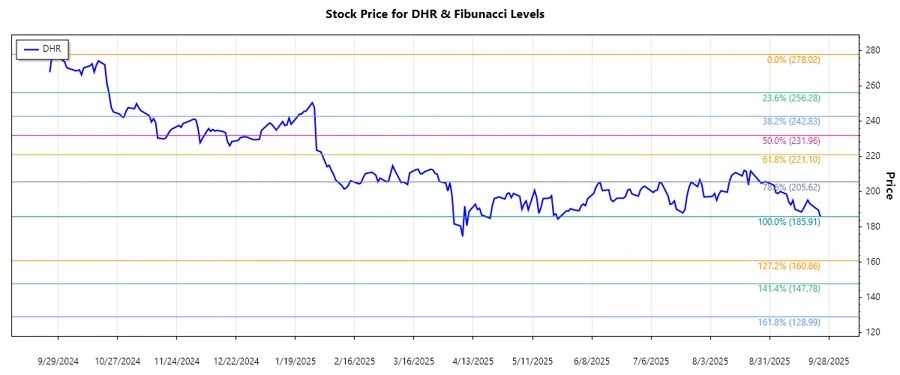
Danaher Corporation (DHR) has experienced a significant downward trend over the recent months. With its diverse range of products and operations, spanning life sciences, diagnostics, and environmental solutions, the company remains robust despite recent market challenges. However, the recent trend reflects broader market conditions affecting the stock price.
Fibonacci Analysis
| Parameter | Detail |
|---|---|
| Start- und Enddatum des Trends | 2024-10-01 bis 2025-09-24 |
| Hochpunkt | 278.02 (2024-09-30) |
| Tiefpunkt | 185.91 (2025-09-24) |
| Fibonacci-Level |
|
| Aktueller Kurs und Retracement-Bereich | 185.91, none |
| Technische Interpretation | Der aktuelle Kurs befindet sich unterhalb der Fibonacci-Level, was auf möglichen weiteren Widerstand hindeutet. Diese Niveaus könnten bei Marktstärke als zukünftiger Widerstand fungieren. |
Conclusion
Danaher Corporation's stock has been on a downward trend, illustrating the company's current market challenges. As a diversified industrial giant, its resilience is tempered by external market forces. For investors, the current levels might offer a potential entry point if they anticipate a rebound, although caution is warranted given the stock's position below the key Fibonacci levels. Technical analysts must watch for signs of reversal or stabilization within these levels for a clearer trading strategy. With its broad operational base, any positive turn in market sentiments may quickly reflect in the upward movement of the stock price.
Smart Data Insight
Master the Perfect Entry & Exit for this Stock
Don't leave your profits to chance. Historically, this stock follows specific seasonal patterns that institutional traders use to maximize returns.
- ✅ Identify the "Golden Buying Window"
- ✅ Avoid high-risk correction cycles
- ✅ Backtested data from the last 20+ years