August 08, 2025 a 06:44 am
DHR: Fibonacci Analysis - Danaher Corporation
Danaher Corporation, known for its diverse innovative product solutions, shows a relatively volatile market behavior over recent months. Since January 2025, we observe a dominant downward trend as several price peaks have been gradually declining. This can be attributed to recent economic shifts affecting its operational segments and market perceptions. Investors should watch for potential support levels and market reactions at crucial technical points.
Fibonacci Analysis
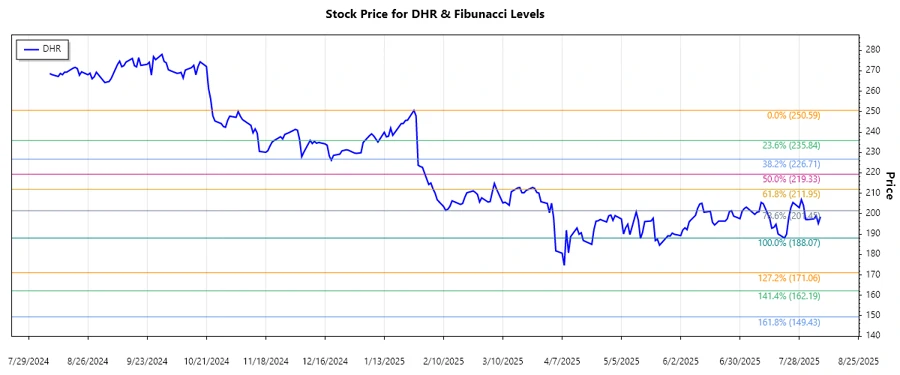
The analysis indicates a dominant downtrend from January to August 2025. Calculating from the high of $250.59 to the low of $188.07, we find key Fibonacci retracement levels that are pivotal for potential reversal or continuation signals.
| Trend Period | High Price | High Date | Low Price | Low Date |
|---|---|---|---|---|
| 2025-01-27 to 2025-07-21 | $250.59 | 2025-01-27 | $188.07 | 2025-07-21 |
| Fibonacci Level | Price |
|---|---|
| 0.236 | $203.34 |
| 0.382 | $212.67 |
| 0.5 | $219.33 |
| 0.618 | $226.00 |
| 0.786 | $235.34 |
Currently, the price is hovering around $198.49, indicating it is reconciling within the 0.236 retracement region.
This suggests a mild bearish sentiment, with potential resistance at the 0.382 level.
Conclusion
Despite recent downtrends, Danaher Corporation's diverse business model offers resilience and potential market correction opportunities. Monitoring support levels at the 0.382 retracement could indicate potential buying interests. However, further declines could bring more severe resistance, given economic uncertainties in primary market sectors. Analysts recommend cautious optimism, with a strategic eye on technical levels for market-entry points. The evolving landscape of Danaher's offerings continues to make it a significant player, despite current price signals.
Smart Data Insight
Master the Perfect Entry & Exit for this Stock
Don't leave your profits to chance. Historically, this stock follows specific seasonal patterns that institutional traders use to maximize returns.
- ✅ Identify the "Golden Buying Window"
- ✅ Avoid high-risk correction cycles
- ✅ Backtested data from the last 20+ years