
February 23, 2026 a 03:31 pm

DHR: Dividend Analysis - Danaher Corporation
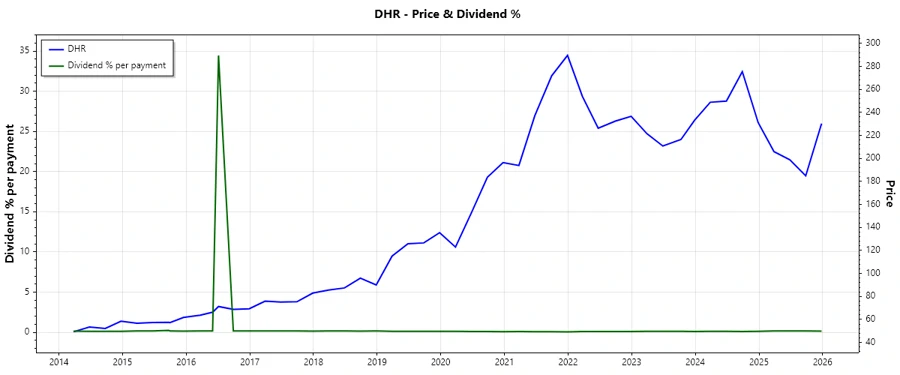
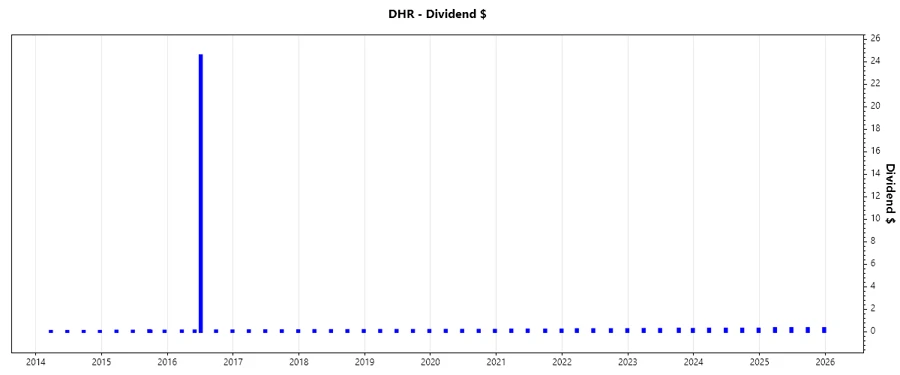
Danaher Corporation exhibits a stable dividend track record with over 33 years of dividend history. Despite a relatively low dividend yield of approximately 0.56%, the company's commitment to consistent dividend payments without major cuts since 2017 demonstrates a strong dividend policy. The moderate dividend growth over the last five years indicates a steady and progressive approach to shareholder returns. Investors should focus on Danaher's ability to sustain this growth trajectory through its strategic financial management.
📊 Overview
Danaher Corporation operates within a sector known for its innovative advancements and steady financial performance. Analyzing its dividend metrics provides insight into its long-term fiscal strategies.
| Indicator | Value |
|---|---|
| Sector | Conglomerates |
| Dividend yield | 0.56% |
| Current dividend per share | 1.24 USD |
| Dividend history | 33 years |
| Last cut or suspension | 2017 |
🗣️ Dividend History
Understanding Danaher's dividend history is essential for assessing its reliability and the stability of its pay-outs. Consistent dividend growth reflects the company's robust cash flow and commitment to rewarding shareholders.
| Year | Dividend per Share (USD) |
|---|---|
| 2025 | 1.28 |
| 2024 | 1.08 |
| 2023 | 0.99 |
| 2022 | 0.89 |
| 2021 | 0.74 |
📈 Dividend Growth
The growth of a company's dividends over time can signal management's confidence in future earnings potential. Danaher has demonstrated moderate but steady dividend growth over the last few years.
| Time | Growth |
|---|---|
| 3 years | 13.02% |
| 5 years | 14.93% |
The average dividend growth is 14.93% over 5 years. This shows moderate but steady dividend growth.
📉 Payout Ratio
The payout ratio is a key metric in understanding whether a company's dividends are sustainable. Danaher's payout ratios reflect its ability to maintain a conservative approach to dividend distribution.
| Key figure ratio | Value (%) |
|---|---|
| EPS-based | 24.29% |
| Free cash flow-based | 16.68% |
Danaher's payout ratios are relatively low at 24.29% (EPS) and 16.68% (FCF), suggesting that its dividends are well-covered by earnings and cash flow, providing a buffer against economic downturns.
✅ Cashflow & Capital Efficiency
The company's ability to generate free cash flow, alongside capital efficiency metrics, can highlight its operational strengths.
| Year | 2023 | 2024 | 2025 |
|---|---|---|---|
| Free Cash Flow Yield | 3.39% | 3.16% | 3.25% |
| Earnings Yield | 2.80% | 2.32% | 2.23% |
| CAPEX to Operating Cash Flow | 19.30% | 20.81% | 18.02% |
| Stock-based Compensation to Revenue | 1.28% | 1.21% | 1.55% |
| Free Cash Flow / Operating Cash Flow Ratio | 80.70% | 79.19% | 81.98% |
Strong cash flows and efficient CAPEX allocation denote Danaher's resilience and ability to generate sufficient liquidity to meet its obligations and invest in growth opportunities.
⚠️ Balance Sheet & Leverage Analysis
A company's leverage and liquidity ratios are crucial for determining its financial health and risk level.
| Year | 2023 | 2024 | 2025 |
|---|---|---|---|
| Debt-to-Equity | 0.365 | 0.346 | 0.351 |
| Debt-to-Assets | 0.231 | 0.221 | 0.221 |
| Debt-to-Capital | 0.268 | 0.257 | 0.260 |
| Net Debt to EBITDA | 1.82 | 2.07 | 1.99 |
| Current Ratio | 1.68 | 1.40 | 1.87 |
| Quick Ratio | 1.37 | 1.05 | 1.51 |
| Financial Leverage | 1.58 | 1.57 | 1.59 |
Danaher's conservative leverage ratios and strong liquidity position reflect a stable financial foundation, minimizing risk exposure and supporting long-term growth and sustainability.
💼 Fundamental Strength & Profitability
Profitability metrics are indicative of a company's operational efficiency and the effectiveness of its management in deploying resources.
| Year | 2023 | 2024 | 2025 |
|---|---|---|---|
| Return on Equity | 8.91% | 7.87% | 6.88% |
| Return on Assets | 5.64% | 5.03% | 4.33% |
| Net Margin | 19.94% | 16.33% | 14.71% |
| EBIT Margin | 22.32% | 20.62% | 18.31% |
| EBITDA Margin | 31.39% | 30.48% | 28.27% |
| Gross Margin | 58.74% | 59.50% | 60.93% |
| R&D to Revenue | 6.29% | 6.63% | 6.50% |
Danaher's robust profitability metrics and strategic investment in R&D underscore its competitive edge and ability to innovate continually.
📉 Price Development
🗳️ Dividend Scoring System
| Criteria | Score | Score Bar |
|---|---|---|
| Dividend yield | 2 | |
| Dividend Stability | 5 | |
| Dividend growth | 4 | |
| Payout ratio | 5 | |
| Financial stability | 5 | |
| Dividend continuity | 5 | |
| Cashflow Coverage | 4 | |
| Balance Sheet Quality | 5 |
Total Score: 35/40
⭐ Rating
Danaher Corporation is a financially robust entity with a strong focus on sustainable dividend growth. The company's prudent management of its payout ratios, coupled with solid cash flow generation, underpins its ability to maximize shareholder value. Although its current yield may not attract income-seeking investors, the company's stability and growth prospects present a compelling case for long-term investment.
Smart Data Insight
Master the Perfect Entry & Exit for this Stock
Don't leave your profits to chance. Historically, this stock follows specific seasonal patterns that institutional traders use to maximize returns.
- ✅ Identify the "Golden Buying Window"
- ✅ Avoid high-risk correction cycles
- ✅ Backtested data from the last 20+ years