February 10, 2026 a 07:47 am

DHR: Dividend Analysis - Danaher Corporation
Danaher Corporation, a leader in the diversified industrials sector, exhibits a robust dividend profile with a remarkable 33-year history of payments. Despite a lower-than-average dividend yield of 0.56%, the company's consistent payout and historical growth make it an attractive option for long-term investors. Notably, Danaher's prudent financial management, reflected in its EPS-based payout ratio of 24.29%, ensures sustained dividend security.
📊 Overview
| Key Factor | Details |
|---|---|
| Sector | Diversified Industrials |
| Dividend Yield | 0.56% |
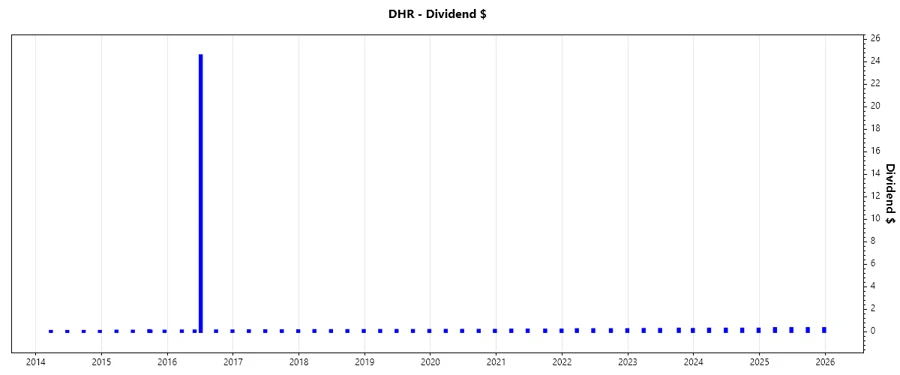
| Current Dividend per Share | 1.24 USD |
| Dividend History | 33 years |
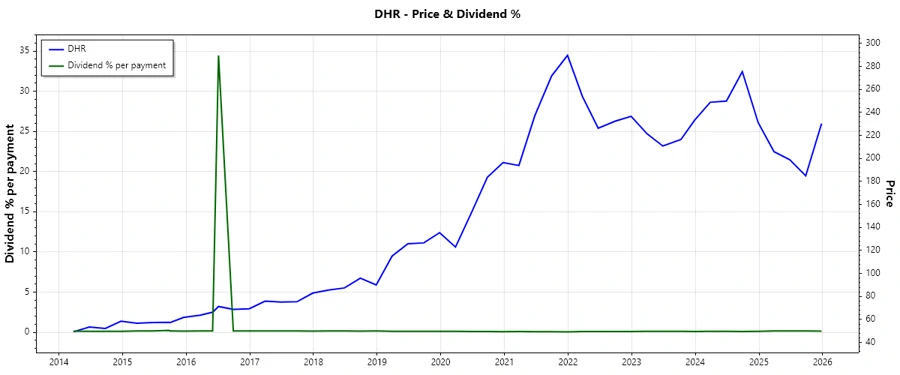
| Last Cut or Suspension | 2017 |
🗣️ Dividend History
The dividend history of Danaher Corporation illustrates its steadfast commitment to returning capital to shareholders. A consistent dividend payment over the past 33 years without significant interruptions highlights its financial resilience and discipline.
| Year | Dividend per Share (USD) |
|---|---|
| 2025 | 1.28 |
| 2024 | 1.08 |
| 2023 | 0.99 |
| 2022 | 0.89 |
| 2021 | 0.74 |
📈 Dividend Growth
The dividend growth metrics of Danaher indicate a healthy, upward trend over time. Consistent capital returns demonstrate the company’s focus on value creation while maintaining robust reinvestment for future growth.
| Time | Growth |
|---|---|
| 3 years | 13.03% |
| 5 years | 14.93% |
The average dividend growth is 14.93% over 5 years. This shows moderate but steady dividend growth, which is beneficial for long-term investors.
🔍 Payout Ratio
The payout ratio analysis is crucial to evaluate the sustainability of the dividends. A low EPS-based payout ratio at 24.29% indicates adequate earnings cover for dividends, ensuring stability and room for growth.
| Key Figure | Ratio |
|---|---|
| EPS-based | 24.29% |
| Free cash flow-based | 16.68% |
The EPS payout ratio of 24.29% and FCF payout of 16.68% suggest a secure dividend policy with the potential for future increases as earnings and cash flow grow.
💰 Cashflow & Capital Efficiency
Danaher's cash flow and capital efficiency performance underscore its capability to manage operational costs and optimize capital allocation, key indicators of financial health.
| Metric | 2023 | 2024 | 2025 |
|---|---|---|---|
| Free Cash Flow Yield | 3.39% | 3.16% | 3.25% |
| Earnings Yield | 2.80% | 2.32% | 2.23% |
| CAPEX to Operating Cash Flow | 19.30% | 20.81% | 18.02% |
| Stock-based Compensation to Revenue | 1.28% | 1.21% | 1.55% |
| Free Cash Flow / Operating Cash Flow Ratio | 80.70% | 79.19% | 81.98% |
These metrics collectively highlight robust cash flow handling and associated capital efficiency, which are instrumental for sustaining shareholder returns.
💼 Balance Sheet & Leverage Analysis
Thorough leverage analysis ensures a clear understanding of a firm's risk profile and its capability to meet long-term obligations efficiently.
| Metric | 2023 | 2024 | 2025 |
|---|---|---|---|
| Debt-to-Equity | 36.53% | 34.61% | 35.06% |
| Debt-to-Assets | 23.12% | 22.11% | 22.07% |
| Debt-to-Capital | 26.75% | 25.71% | 25.96% |
| Net Debt to EBITDA | 1.82 | 2.07 | 1.99 |
| Current Ratio | 1.68 | 1.40 | 1.87 |
| Quick Ratio | 1.37 | 1.05 | 1.51 |
| Financial Leverage | 1.58 | 1.57 | 1.59 |
By maintaining moderate leverage ratios and solid liquidity metrics, Danaher portrays a stable financial structure, essential for long-term fiscal solvency and operational agility.
📈 Fundamental Strength & Profitability
Profitability metrics provide insights into Danaher’s operational efficiency, market position, and ability to generate returns for shareholders efficiently.
| Metric | 2023 | 2024 | 2025 |
|---|---|---|---|
| Return on Equity | 8.91% | 7.87% | 6.88% |
| Return on Assets | 5.64% | 5.03% | 4.33% |
| Net Margin | 19.94% | 16.33% | 14.71% |
| EBIT Margin | 22.32% | 20.62% | 18.31% |
| EBITDA Margin | 31.39% | 30.48% | 28.27% |
| Gross Margin | 58.74% | 59.50% | 60.93% |
| Research & Development to Revenue | 6.29% | 6.63% | 6.50% |
The company's strength in profitability across various margins demonstrates its adept management capabilities, providing substantial returns on both equity and assets.
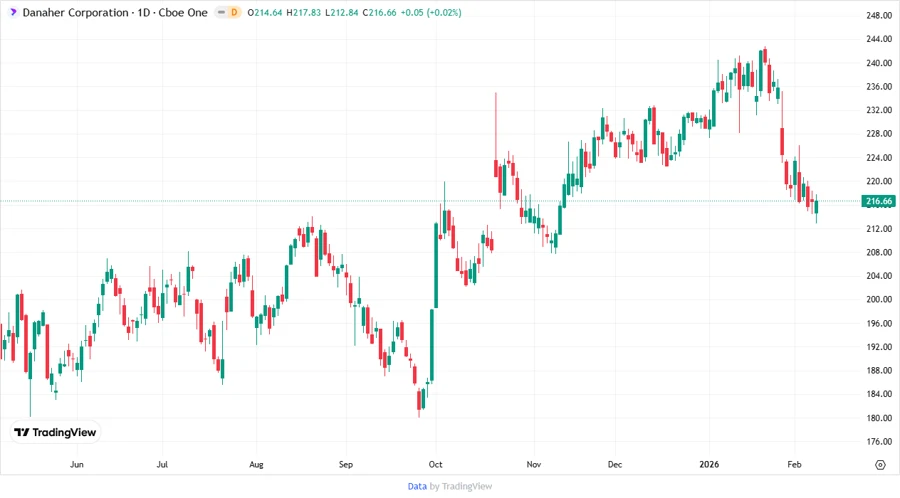
💡 Price Development
✅ Dividend Scoring System
| Metric | Score | Visualization |
|---|---|---|
| Dividend Yield | 3 | |
| Dividend Stability | 5 | |
| Dividend Growth | 4 | |
| Payout Ratio | 4 | |
| Financial Stability | 5 | |
| Dividend Continuity | 5 | |
| Cashflow Coverage | 4 | |
| Balance Sheet Quality | 5 |
Total Score: 35/40
🔖 Rating
In conclusion, Danaher Corporation presents a compelling investment opportunity for dividend-focused investors, underpinned by its consistent and robust dividend history, steady growth trajectory, and solid financial foundation. With a strong overall dividend score of 35 out of 40, we recommend considering Danaher for a diversified dividend growth portfolio.
Smart Data Insight
Master the Perfect Entry & Exit for this Stock
Don't leave your profits to chance. Historically, this stock follows specific seasonal patterns that institutional traders use to maximize returns.
- ✅ Identify the "Golden Buying Window"
- ✅ Avoid high-risk correction cycles
- ✅ Backtested data from the last 20+ years