June 18, 2026 a 01:15 pm


DHI: Trend and Support & Resistance Analysis - D.R. Horton, Inc.
D.R. Horton, Inc. has shown a period of dynamic market activity with significant volatility in recent months. The technical indicators suggest the presence of a developing trend that investors should pay close attention to. The market conditions might provide potential opportunities, yet, they also come with inherent risks, given the broader economic factors affecting the construction industry. Keeping a watch on the support and resistance levels could provide crucial insights for future price movements. Investors are advised to consider these technical aspects alongside fundamental analysis for informed decision-making.
Trend Analysis
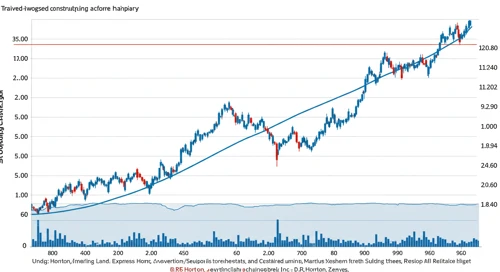
The recent analysis of D.R. Horton, Inc.'s price data identifies a fluctuating trend with a general phase of recovery from earlier lows. The calculated EMA20 exceeds the EMA50, suggesting a bullish outlook hence an upward trend is prominent. This trend implies increased investor confidence and a potential recovery in homebuilding markets.
| Date | Closing Price | Trend |
|---|---|---|
| 2026-06-17 | $152.48 | ▲ Uptrend |
| 2026-06-16 | $156.33 | ▲ Uptrend |
| 2026-06-15 | $155.09 | ▲ Uptrend |
| 2026-06-12 | $154.09 | ▲ Uptrend |
| 2026-06-11 | $154.43 | ▲ Uptrend |
| 2026-06-10 | $146.71 | ▲ Uptrend |
| 2026-06-09 | $151.07 | ▲ Uptrend |
In conclusion, the market sentiment appears positive, indicating reinforced investor interest as prices stabilize and rise above key moving averages.
Support and Resistance
Through detailed evaluation, we've determined pivotal support and resistance levels that are essential for traders to observe. These levels indicate potential reversal points and areas of price consolidation or breakout.
| Zone Type | Range (From) | Range (To) |
|---|---|---|
| Support 1 | $137.00 | $141.00 |
| Support 2 | $144.00 | $147.00 |
| Resistance 1 | $156.00 | $159.00 |
| Resistance 2 | $162.00 | $165.00 |
Current prices are approaching the lower ranges of resistance, suggesting potential upward momentum but also caution for possible corrections or pullbacks.
Conclusion
Analyzing D.R. Horton, Inc.'s stock, the technical indicators reveal a positive outlook with a prevailing bullish trend, likely influenced by market recoveries and investor optimism. However, the stock faces multiple resistance levels that may test the strength of this trend. Investors should remain vigilant of macroeconomic developments affecting the housing market, which can significantly impact D.R. Horton's performance. While promising opportunities exist for growth, market volatility and external economic pressures pose continual risks that need to be managed effectively.
Smart Data Insight
Master the Perfect Entry & Exit for this Stock
Don't leave your profits to chance. Historically, this stock follows specific seasonal patterns that institutional traders use to maximize returns.
- ✅ Identify the "Golden Buying Window"
- ✅ Avoid high-risk correction cycles
- ✅ Backtested data from the last 20+ years