May 01, 2025 a 08:15 am

DHI: Trend and Support & Resistance Analysis - D.R. Horton, Inc.
The analysis of D.R. Horton, Inc., a leading homebuilding company, shows nuanced market movements based on recent data trends. This report explores potential future movements based on technical indicators such as EMA trends and identified support and resistance zones. Investors can use this insight to better strategize their investment approaches amid a changing housing market landscape.
Trend Analysis
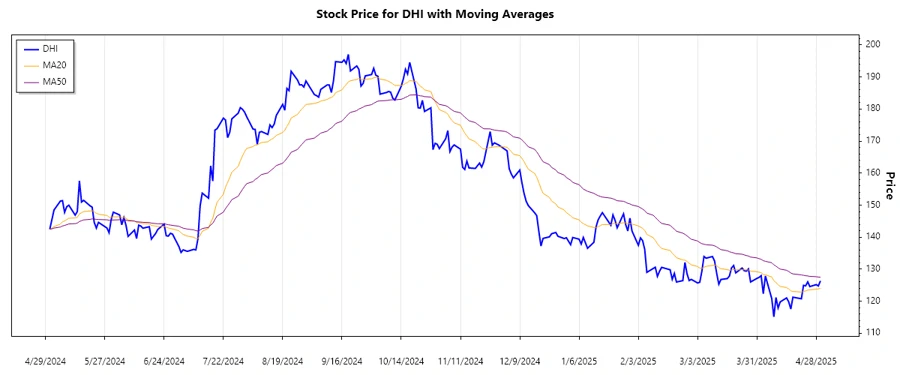
The calculated EMAs reveal significant insights into the stock's trend. Analyzing the closing prices over the recent months, we observe fluctuations that provide a clear indication of the market's behavior.
| Date | Closing Price | Trend |
|---|---|---|
| 2025-04-30 | $126.34 | ▼ Downtrend |
| 2025-04-29 | $124.75 | ▼ Downtrend |
| 2025-04-28 | $125.17 | ▲ Uptrend |
| 2025-04-25 | $124.56 | ▼ Downtrend |
| 2025-04-24 | $126.04 | ▲ Uptrend |
| 2025-04-23 | $124.79 | ▼ Downtrend |
| 2025-04-22 | $124.96 | ▼ Downtrend |
The trend analysis indicates a prevailing downward movement. Given that the EMA20 often remains below the EMA50 during this period, a bearish trend is clearly evident. This suggests potential selling pressure.
Support- and Resistance
Identifying key support and resistance zones aids in predicting potential reversal points. Here are the calculated zones based on the recent stock price consolidations.
| Type | Zone From | Zone To |
|---|---|---|
| Support | ▼ $120.00 | ▼ $122.00 |
| Support | ▼ $125.00 | ▼ $126.00 |
| Resistance | ▲ $130.00 | ▲ $132.00 |
| Resistance | ▲ $135.00 | ▲ $138.00 |
Currently, the stock price hovers close to the lower support zone, indicating potential for a price correction if no significant upward catalysts are introduced.
Conclusion
In conclusion, D.R. Horton, Inc. faces a prevailing downtrend, as indicated by the EMA patterns and lack of bullish momentum. The identified support zones provide a potential buffer that could help in re-establishing stability if challenges in the housing market ease. Monitoring external economic factors will be crucial, as they could quickly alter these predictions. While the resistance levels outline potential hurdles for upward progress, breakthrough above these could signal new bullish phases. Investors should weigh these technical insights alongside broader market conditions for informed decision-making.
Smart Data Insight
Master the Perfect Entry & Exit for this Stock
Don't leave your profits to chance. Historically, this stock follows specific seasonal patterns that institutional traders use to maximize returns.
- ✅ Identify the "Golden Buying Window"
- ✅ Avoid high-risk correction cycles
- ✅ Backtested data from the last 20+ years