
May 27, 2026 a 06:44 am
DHI: Fibonacci Analysis - D.R. Horton, Inc.
D.R. Horton, Inc. has shown a notable upward trend over the last few months in the homebuilding sector. While fluctuations are inherent in the housing market, the company's strategic land acquisitions and home offerings across the United States have strengthened its market position. With current market dynamics, analysts are keenly observing if this momentum can be sustained amidst varying economic conditions.
Fibonacci Analysis
| Aspect | Details |
|---|---|
| Trend Start Date | 2026-03-25 |
| Trend End Date | 2026-05-26 |
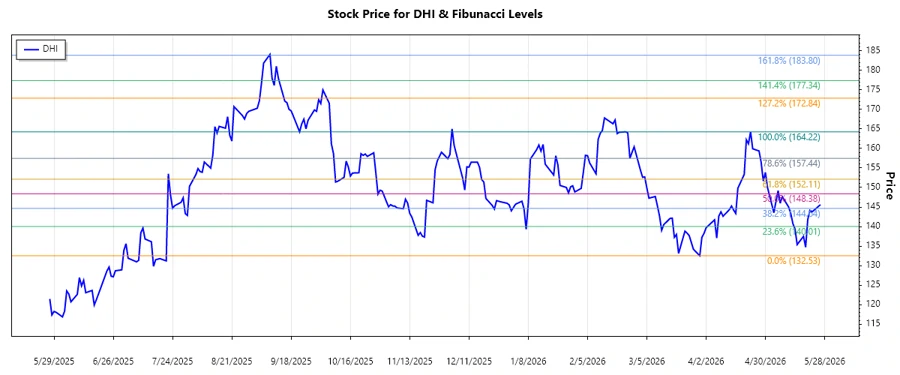
| High Point | $164.22 on 2026-04-23 |
| Low Point | $132.53 on 2026-03-30 |
Fibonacci Retracement Levels
| Level | Price |
|---|---|
| 0.236 | $140.51 |
| 0.382 | $144.70 |
| 0.5 | $148.38 |
| 0.618 | $152.06 |
| 0.786 | $157.36 |
The current price of $145.6 is within the 0.382 Fibonacci retracement level, indicating a potential support area. If support holds, it could signal continued upward momentum. Analysts often view this retracement as crucial in determining the potential continuation of the bullish trend. Breaking this level may suggest further retracement.
Conclusion
D.R. Horton, Inc.'s stock is currently experiencing an upward trend with recent data placing the price within a crucial retracement level. This scenario presents both opportunities for potential gains if the support holds, as well as risks associated with market volatility and economic shifts in the housing sector. For analysts, maintaining vigilance on economic indicators and housing demand will provide insight on the sustainability of this trend. Adjustments to economic policies or unexpected market dynamics could impact the stock's trajectory significantly.
Smart Data Insight
Master the Perfect Entry & Exit for this Stock
Don't leave your profits to chance. Historically, this stock follows specific seasonal patterns that institutional traders use to maximize returns.
- ✅ Identify the "Golden Buying Window"
- ✅ Avoid high-risk correction cycles
- ✅ Backtested data from the last 20+ years