December 02, 2025 a 06:44 am
DHI: Fibonacci Analysis - D.R. Horton, Inc.
D.R. Horton, Inc., operating as a leading homebuilder in the United States, offers significant potential in the residential construction market. The stock has shown robust growth, reflecting strong demand for housing and solid business strategies. Recent market activities suggest possible fluctuations, yet the company’s diversified market presence supports its stability. Careful monitoring of economic indicators affecting housing demand is crucial for investors.
Fibonacci Analysis
| Item | Details |
|---|---|
| Trend Duration | 2025-12-01 to 2024-12-02 |
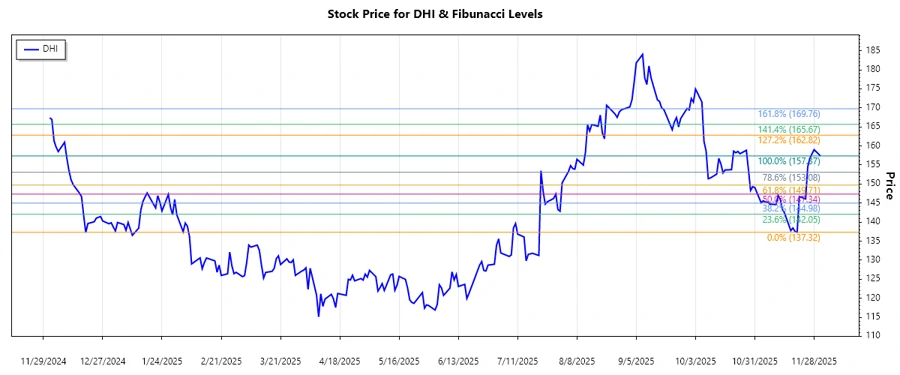
| High Point (Date/Price) | 2025-12-01 / $157.37 |
| Low Point (Date/Price) | 2025-11-20 / $137.32 |
| Fibonacci Level | Price Level |
|---|---|
| 0.236 | $152.36 |
| 0.382 | $149.64 |
| 0.5 | $147.35 |
| 0.618 | $145.06 |
| 0.786 | $141.98 |
The current price is above the 0.236 retracement level, indicating strength after a recent correction. This suggests potential resistance at the higher Fibonacci levels if the bullish trend continues.
Conclusion
The upward trend in D.R. Horton's stock price highlights its strong position in the housing market. With a consistent demand for housing and financial services, the company remains well-positioned despite economic uncertainties. While the stock faces potential resistance at key Fibonacci levels, its diversification and market strategies provide a buffer against volatility. Investors should remain vigilant of macroeconomic factors that could impact housing demand but can remain optimistic about D.R. Horton's growth trajectory.
Smart Data Insight
Master the Perfect Entry & Exit for this Stock
Don't leave your profits to chance. Historically, this stock follows specific seasonal patterns that institutional traders use to maximize returns.
- ✅ Identify the "Golden Buying Window"
- ✅ Avoid high-risk correction cycles
- ✅ Backtested data from the last 20+ years