April 26, 2026 a 02:46 am

DHI: Dividend Analysis - D.R. Horton, Inc.
D.R. Horton, Inc. demonstrates a reliable dividend history with a nearly stable growth trajectory over the years. Despite a moderate dividend yield, its substantial growth in recent years and robust financials make it a promising stock for dividend-focused investors. The company's conservative payout ratio underscores a commitment to sustainable dividend practices.
📊 Overview
D.R. Horton, Inc. operates in the Consumer Goods sector and offers a dividend yield of approximately 1.09%. The company maintains a strong dividend history spanning 30 years, with no recent cuts or suspensions. This highlights its capability to uphold dividend commitments.
| Aspect | Detail |
|---|---|
| Sector | Consumer Goods |
| Dividend Yield | 1.09 % |
| Current Dividend per Share | 1.60 USD |
| Dividend History | 30 years |
| Last Cut or Suspension | None |
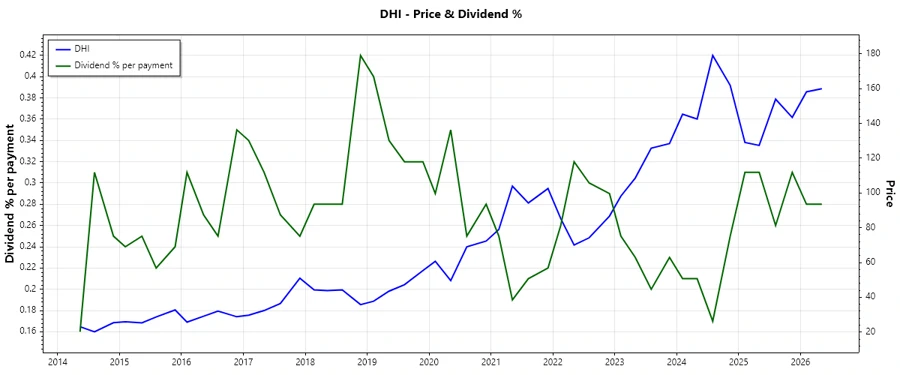
📈 Dividend History
The dividend history of D.R. Horton, Inc. provides insights into its commitment to returning value to shareholders. A stable or growing dividend history builds investor trust and can indicate strong financial health.
| Year | Dividend per Share (USD) |
|---|---|
| 2026 | 0.90 |
| 2025 | 1.65 |
| 2024 | 1.30 |
| 2023 | 1.05 |
| 2022 | 0.925 |
📉 Dividend Growth
The growth of dividends over time is a critical factor for gauging the company's potential for future dividend increases. D.R. Horton's dividends have grown consistently, reflecting a stable earnings capability.
| Time | Growth |
|---|---|
| 3 years | 21.28 % |
| 5 years | 17.88 % |
The average dividend growth is 17.88% over 5 years. This shows moderate but steady dividend growth.
🗣️ Payout Ratio
The payout ratio indicates the proportion of earnings being distributed as dividends, offering insights into payout sustainability. A low ratio suggests D.R. Horton retains sufficient earnings for reinvestment.
| Key figure | Ratio |
|---|---|
| EPS-based | 14.55 % |
| Free cash flow-based | 13.29 % |
The payout ratios of 14.55% (EPS) and 13.29% (FCF) reflect a conservative approach, leaving room for growth and other investments.
🔍 Cashflow & Capital Efficiency
A comprehensive analysis of free cash flow and capital efficiency illustrates a company's ability to generate cash to cover mandates and support growth.
| Aspect | 2023 | 2024 | 2025 |
|---|---|---|---|
| Free Cash Flow Yield | 11.35 % | 3.22 % | 6.28 % |
| Earnings Yield | 12.96 % | 7.57 % | 6.86 % |
| CAPEX to Operating Cash Flow | 3.45 % | 7.55 % | 4.02 % |
| Stock-based Compensation to Revenue | 0.31 % | 0.32 % | 0.38 % |
| Free Cash Flow / Operating Cash Flow Ratio | 96.55 % | 92.45 % | 95.98 % |
D.R. Horton's strong cash flow and capital deployment indicate efficient use of resources, paving the way for sustained growth and shareholder returns.
🏦 Balance Sheet & Leverage Analysis
The evaluation of leverage and liquidity ratios provide insights into D.R. Horton's financial stability and its ability to service debt.
| Aspect | 2023 | 2024 | 2025 |
|---|---|---|---|
| Debt-to-Equity | 22.66 % | 23.59 % | 24.93 % |
| Debt-to-Assets | 15.78 % | 16.54 % | 17.00 % |
| Debt-to-Capital | 18.47 % | 19.09 % | 19.95 % |
| Net Debt to EBITDA | 0.20 | 0.23 | 0.63 |
| Current Ratio | 14.96 | 17.06 | 17.39 |
| Quick Ratio | 4.22 | 4.83 | 4.51 |
| Financial Leverage | 143.56 % | 142.63 % | 146.63 % |
The company's manageable leverage and strong liquidity position offer confidence in its ability to handle obligations and sustain operations.
🔑 Fundamental Strength & Profitability
Fundamental ratios shed light on operational efficiency and long-term profitability, forming an essential part of financial assessments.
| Aspect | 2023 | 2024 | 2025 |
|---|---|---|---|
| Return on Equity | 20.91 % | 18.79 % | 14.82 % |
| Return on Assets | 14.57 % | 13.17 % | 10.11 % |
| Margins: Net | 13.38 % | 12.92 % | 10.47 % |
| EBIT | 17.81 % | 17.07 % | 13.84 % |
| EBITDA | 18.07 % | 17.31 % | 14.13 % |
| Gross | 26.37 % | 25.91 % | 23.70 % |
| R&D to Revenue | 0 % | 0 % | 0 % |
High profitability and margin ratios underscore efficiency and effective cost management, essential for sustaining competitive advantages.
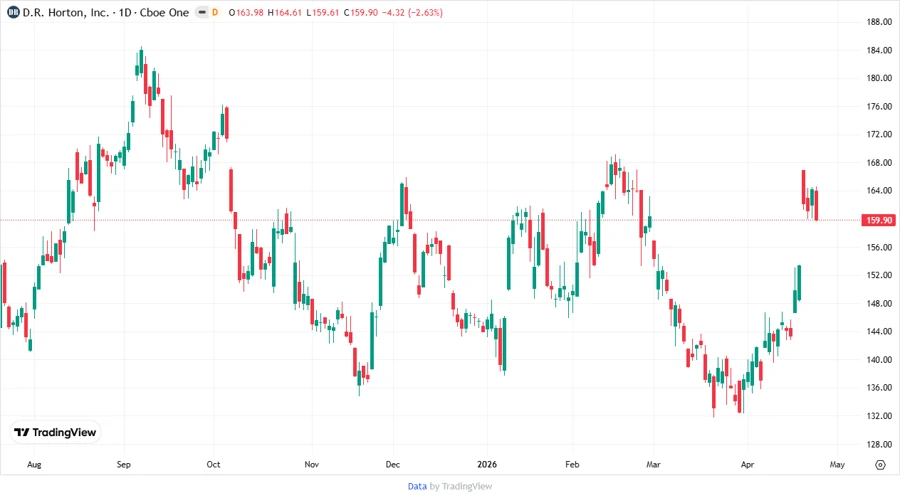
📈 Price Development
✅ Dividend Scoring System
| Category | Score (1-5) | Score Bar |
|---|---|---|
| Dividend Yield | 3 | |
| Dividend Stability | 5 | |
| Dividend Growth | 4 | |
| Payout Ratio | 5 | |
| Financial Stability | 4 | |
| Dividend Continuity | 5 | |
| Cashflow Coverage | 4 | |
| Balance Sheet Quality | 4 |
Total Score: 34/40
🗣️ Rating
D.R. Horton, Inc. is a strong contender in the dividend stocks space, delivering steady growth with a disciplined payout policy. Despite a moderate yield, its robust financial health and historical stability make it a recommended buy for investors seeking long-term dividend income.
Smart Data Insight
Master the Perfect Entry & Exit for this Stock
Don't leave your profits to chance. Historically, this stock follows specific seasonal patterns that institutional traders use to maximize returns.
- ✅ Identify the "Golden Buying Window"
- ✅ Avoid high-risk correction cycles
- ✅ Backtested data from the last 20+ years