November 19, 2025 a 03:31 am

DHI: Dividend Analysis - D.R. Horton, Inc.
D.R. Horton, Inc. (DHI), a prominent player in the residential construction sector, offers an attractive dividend profile. With a dividend yield of 1.15% and a steadily growing dividend over the past 29 years, the company's commitment to returning value to shareholders is evident. Despite a low payout ratio, indicative of a robust reinvestment strategy, potential investors might find the moderate dividend growth appealing.
📊 Overview
D.R. Horton operates within the resilient residential construction sector, which has consistently demonstrated its capacity to yield dividends over an extended period. The analysis below presents crucial dividend-related metrics:
| Metric | Value |
|---|---|
| Sector | Residential Construction |
| Dividend Yield | 1.15% |
| Current Dividend per Share | 1.60 USD |
| Dividend History | 29 years |
| Last Cut or Suspension | 2014 |
🗣️ Dividend History
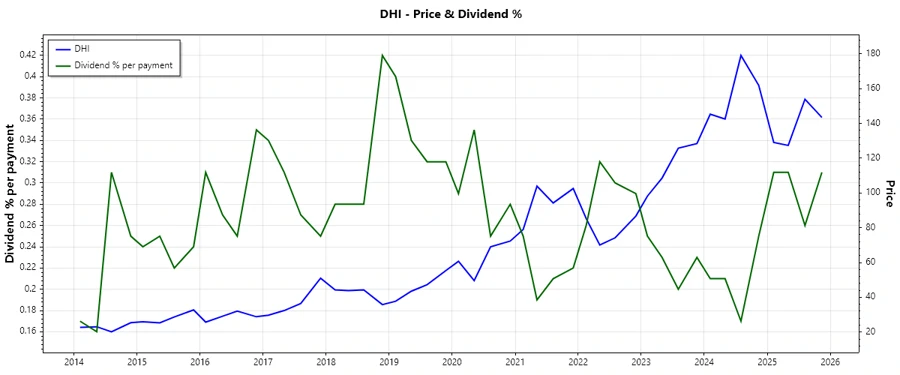
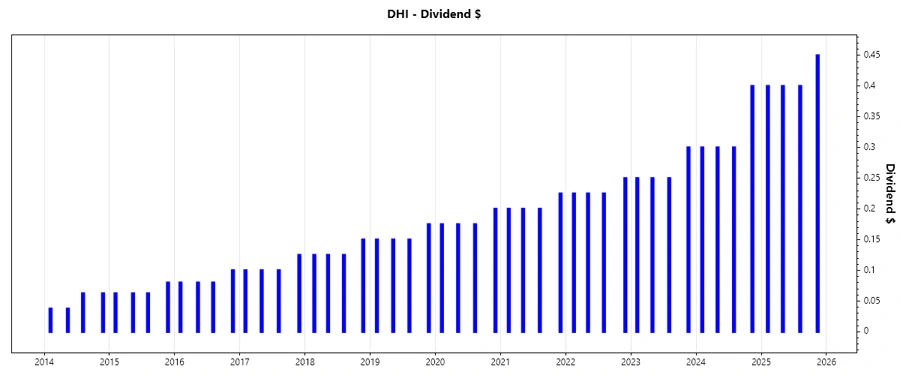
D.R. Horton's extensive dividend history reflects a strong commitment to its shareholders through the regular distribution of profits, thereby enhancing investment attractiveness. The continuity over 29 years, with significant milestones post-2014, underscores financial robustness and managerial prudence.
| Year | Dividend per Share (USD) |
|---|---|
| 2025 | 1.65 |
| 2024 | 1.30 |
| 2023 | 1.05 |
| 2022 | 0.925 |
| 2021 | 0.825 |
📈 Dividend Growth
The growth in dividends over both three and five years serves as a favorable indicator of increasing profitability and strategic financial management. Consistent growth rates, as presented below, highlight sustained shareholder value enhancement through a structured dividend policy.
| Time | Growth |
|---|---|
| 3 years | 16.37% |
| 5 years | 15.77% |
The average dividend growth is 15.77% over 5 years. This shows moderate but steady dividend growth.
⚠️ Payout Ratio
The payout ratio, a fundamental indicator of dividend sustainability, outlines D.R. Horton's ability to cover dividends through earnings and free cash flows. Both EPS and FCF-based ratios are presented below, uncomplicatedly demonstrating the firm’s disciplined dividend strategy.
| Key figure | Ratio |
|---|---|
| EPS-based | 13.25% |
| Free cash flow-based | 14.33% |
With a payout ratio of 13.25% (EPS) and 14.33% (FCF), D.R. Horton demonstrates a conservative approach, ensuring sustainable distributions while preserving capital for reinvestment.
💰 Cashflow & Capital Efficiency
Analyzing cash flow efficiency, we observe significant returns on both invested capital and operating cash flow, suggesting effective management of assets and equity. This section delves into vital metrics, indicating sound financial health.
| 2025 | 2024 | 2023 | |
|---|---|---|---|
| Free Cash Flow Yield | 6.28% | 3.22% | 11.35% |
| Earnings Yield | 6.86% | 7.57% | 12.96% |
| CAPEX to Operating Cash Flow | 3.63% | 7.55% | 3.45% |
| Stock-based Compensation to Revenue | 0.22% | 0.32% | 0.31% |
| Free Cash Flow / Operating Cash Flow Ratio | 95.98% | 92.45% | 96.55% |
The company's high free cash flow conversion and controlled CAPEX imply substantial reinvestment potential while preserving shareholder payouts.
🧾 Balance Sheet & Leverage Analysis
A thorough examination of financial leverage and liquidity ratios below showcases D.R. Horton's capacity to meet its obligations, characterize capital structure and maintain ample financial stability through prudent credit management.
| 2025 | 2024 | 2023 | |
|---|---|---|---|
| Debt-to-Equity | 0.25 | 0.24 | 0.23 |
| Debt-to-Assets | 0.17 | 0.17 | 0.16 |
| Debt-to-Capital | 0.20 | 0.19 | 0.18 |
| Net Debt to EBITDA | 0.61 | 0.23 | 0.20 |
| Current Ratio | 6.48 | 17.06 | 14.96 |
| Quick Ratio | 1.18 | 4.83 | 4.22 |
| Financial Leverage | 1.47 | 1.43 | 1.43 |
Low debt ratios and high liquidity underscore financial soundness, capable of sustaining operations while strategically leveraging for growth.
✅ Fundamental Strength & Profitability
Despite industry volatility, D.R. Horton demonstrates resilience and competitive advantages, as evident through detailed profitability metrics. Higher margins and return ratios signal robust operational capacities and efficiency.
| 2025 | 2024 | 2023 | |
|---|---|---|---|
| Return on Equity | 14.82% | 18.79% | 20.91% |
| Return on Assets | 10.11% | 13.17% | 14.57% |
| Net Margin | 10.47% | 12.92% | 13.38% |
| EBIT Margin | 13.84% | 17.08% | 17.81% |
| EBITDA Margin | 14.13% | 17.31% | 18.07% |
| Gross Margin | 23.70% | 25.91% | 26.37% |
| R&D to Revenue | 0% | 0% | 0% |
Impressive margins and return ratios underscore operational efficiency and effectiveness in resource management, ensuring sustained profitability.
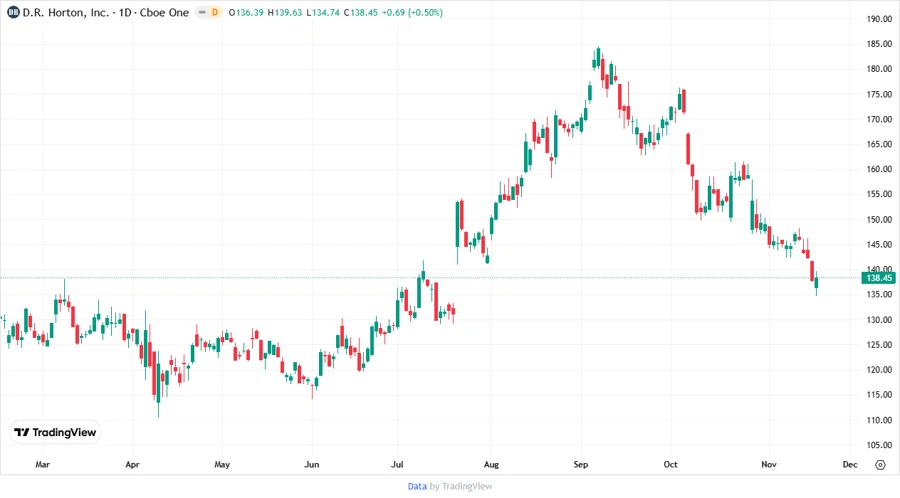
📉 Price Development
⭐ Dividend Scoring System
| Category | Score | Score Bar |
|---|---|---|
| Dividend Yield | 3 | |
| Dividend Stability | 5 | |
| Dividend Growth | 4 | |
| Payout Ratio | 5 | |
| Financial Stability | 4 | |
| Dividend Continuity | 5 | |
| Cashflow Coverage | 4 | |
| Balance Sheet Quality | 5 |
Total Score: 35/40
🏅 Rating
D.R. Horton receives a total dividend score of 35 out of 40, reflecting its strong dividend stability, commendable growth, and prudent financial management. The consistent improvement in financial metrics coupled with a robust balance sheet warrants a favorable investment opportunity with potential for sustained long-term returns.
Smart Data Insight
Master the Perfect Entry & Exit for this Stock
Don't leave your profits to chance. Historically, this stock follows specific seasonal patterns that institutional traders use to maximize returns.
- ✅ Identify the "Golden Buying Window"
- ✅ Avoid high-risk correction cycles
- ✅ Backtested data from the last 20+ years