September 27, 2025 a 12:47 pm
DHI: Dividend Analysis - D.R. Horton, Inc.
D.R. Horton, Inc. presents a stable dividend yield at just over 1%, highlighting a long-term commitment to dividend payments spanning 29 years. With a current payout ratio relatively low at 9.20% EPS-based, there is potential for stability and possible growth. Analysts keep a keen eye on the company's strategic decisions impacting future yield and payout ratios.
📊 Overview
Analyzing D.R. Horton's current dividend setup, we see a prudent policy with a steady yet modest dividend growth trend. Its historical unwavering dividend payments underpin reliability.
| Category | Details |
|---|---|
| Sector | Homebuilding |
| Dividend yield | 1.04% |
| Current dividend per share | 1.20 USD |
| Dividend history | 29 years |
| Last cut or suspension | None |
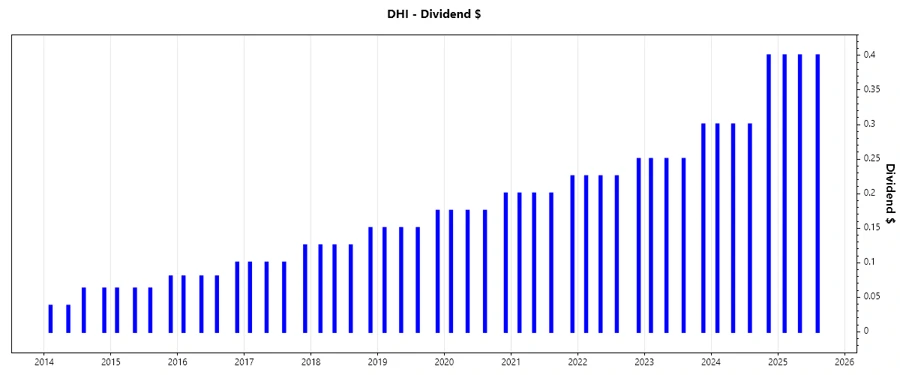
📈 Dividend History
The historical data underline DHI's consistency, with uninterrupted payments over a 29-year span. Investors favor such stability, foreseeing the company's commitment to returning capital.
| Year | Dividend Per Share (USD) |
|---|---|
| 2025 | 1.20 |
| 2024 | 1.30 |
| 2023 | 1.05 |
| 2022 | 0.93 |
| 2021 | 0.83 |
📈 Dividend Growth
The company's dividend growth rates, with a return of 16.37% over the last three years and 15.77% over the past five, depict the strength in its incremental dividend policy.
| Time | Growth |
|---|---|
| 3 years | 16.37% |
| 5 years | 15.77% |
The average dividend growth is 15.77% over 5 years. This shows moderate but steady dividend growth.
🗣️ Payout Ratio
An equitable low payout ratio reflects financial prudence, ensuring dividends are sustainably coupled with earnings.
| Key figure | Ratio |
|---|---|
| EPS-based | 9.20% |
| Free cash flow-based | 12.78% |
The EPS-based payout ratio at 9.20% indicates a conservative approach, providing a margin of safety, while FCF-based 12.78% reinforces the company's ability to cover dividends through cash flows.
🗣️ Cashflow & Capital Efficiency
The complex interplay between cash flows and capital expenditures demonstrates the company's effective cash management practices.
| Metric | 2024 | 2023 | 2022 |
|---|---|---|---|
| Free Cash Flow Yield | 3.22% | 11.35% | 1.75% |
| Earnings Yield | 7.57% | 12.96% | 24.73% |
| CAPEX to Operating Cash Flow | 7.55% | 3.45% | 26.38% |
| Stock-based Compensation to Revenue | 0.32% | 0.31% | 0.31% |
| Free Cash Flow / Operating Cash Flow Ratio | 92.45% | 96.55% | 73.62% |
Overall, solid cash flow returns and affluent yields affirm D.R. Horton’s strong operational cash coverage and capital utilization efficiency.
Balance Sheet & Leverage Analysis
The debt analysis highlights balanced leverage with sustainable metrics that enhance the company's capacity to administer its financial obligations.
| Metric | 2024 | 2023 | 2022 |
|---|---|---|---|
| Debt-to-Equity | 0.24 | 0.23 | 0.31 |
| Debt-to-Assets | 0.17 | 0.16 | 0.20 |
| Debt-to-Capital | 0.19 | 0.18 | 0.24 |
| Net Debt to EBITDA | 0.23 | 0.20 | 0.46 |
| Current Ratio | 17.06 | 14.96 | 13.13 |
| Quick Ratio | 4.83 | 4.22 | 3.26 |
| Financial Leverage | 1.43 | 1.44 | 1.56 |
DHI's financial solidity is asserted by strong leverage ratios, supporting the capacity to manage liabilities effectively.
Fundamental Strength & Profitability
These metrics affirm operational efficiency and the company’s prowess in capital deployment and revenue conversions.
| Metric | 2024 | 2023 | 2022 |
|---|---|---|---|
| Return on Equity | 18.79% | 20.91% | 30.20% |
| Return on Assets | 13.17% | 14.57% | 19.30% |
| Margins: Net | 12.92% | 13.38% | 17.50% |
| EBIT | 17.08% | 17.81% | 22.79% |
| EBITDA | 17.31% | 18.07% | 23.03% |
| Gross | 25.91% | 26.37% | 31.37% |
| Research & Development to Revenue | 0% | 0% | 0% |
Strong profitability ratios indicate effective cost control and revenue maximization, enhancing shareholder returns.
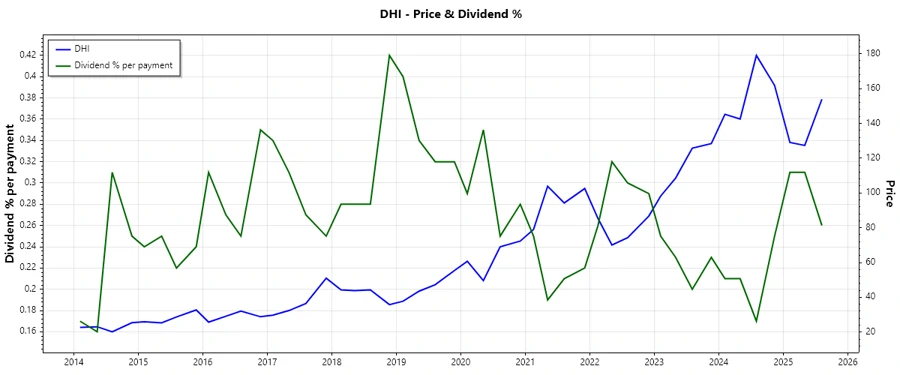
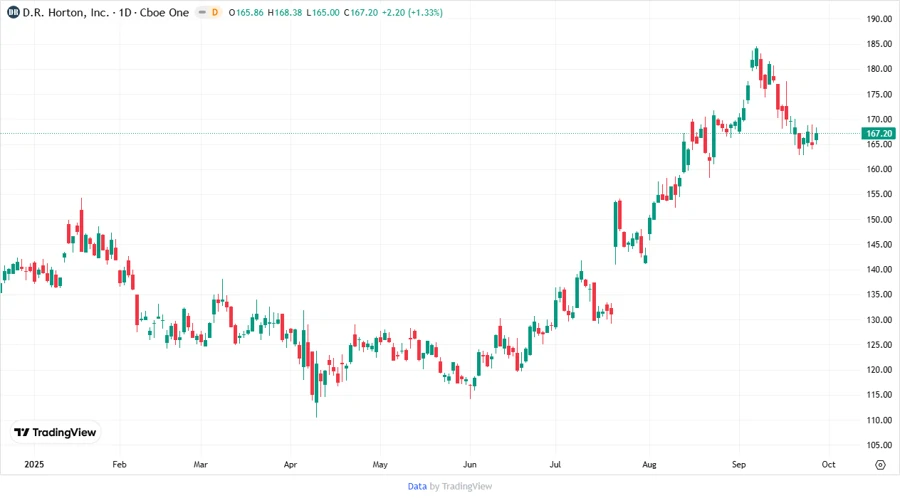
Price Development
Dividend Scoring System
| Criteria | Score | Score Bar |
|---|---|---|
| Dividend yield | 3 | |
| Dividend Stability | 5 | |
| Dividend growth | 4 | |
| Payout ratio | 5 | |
| Financial stability | 4 | |
| Dividend continuity | 5 | |
| Cashflow Coverage | 3 | |
| Balance Sheet Quality | 4 |
Total Score: 33/40
Rating
✅ D.R. Horton, Inc. exhibits robust dividend practices upheld by a consistent growth trajectory and low payout ratios, indicative of financial resilience and shareholder value enhancement. Recommended as a buy for those seeking stable income with potential for capital appreciation.
Smart Data Insight
Master the Perfect Entry & Exit for this Stock
Don't leave your profits to chance. Historically, this stock follows specific seasonal patterns that institutional traders use to maximize returns.
- ✅ Identify the "Golden Buying Window"
- ✅ Avoid high-risk correction cycles
- ✅ Backtested data from the last 20+ years