December 28, 2025 a 01:15 pm

DGX: Trend and Support & Resistance Analysis - Quest Diagnostics Incorporated
Quest Diagnostics Incorporated (DGX) has shown a mixed trend in recent months based on historical data. While there has been a phase of recovery, the overall market environment remains cautious. With its broad portfolio in diagnostic testing and services, DGX is well-positioned to leverage growing healthcare demands internationally.
Trend Analysis
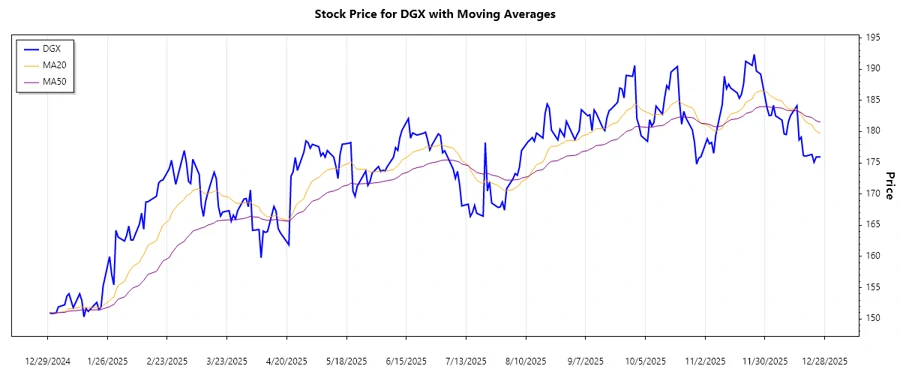
The analysis of Quest Diagnostics Incorporated's recent closing prices indicates fluctuating trends over the past months. By calculating the 20-day and 50-day exponential moving averages (EMA20 and EMA50), we observe changes that suggest different trend directions.
| Date | Closing Price | Trend |
|---|---|---|
| 2025-12-26 | 175.94 | ▲ |
| 2025-12-24 | 175.92 | ▲ |
| 2025-12-23 | 175.08 | ▼ |
| 2025-12-22 | 176.34 | ▲ |
| 2025-12-19 | 176.06 | ▼ |
| 2025-12-18 | 176.15 | ▼ |
| 2025-12-17 | 179.10 | ⚖️ |
The trend analysis shows mixed indications with no clear dominant direction as the EMA20 and EMA50 remain close. This is indicative of a potential transition phase in investor sentiment.
Support and Resistance
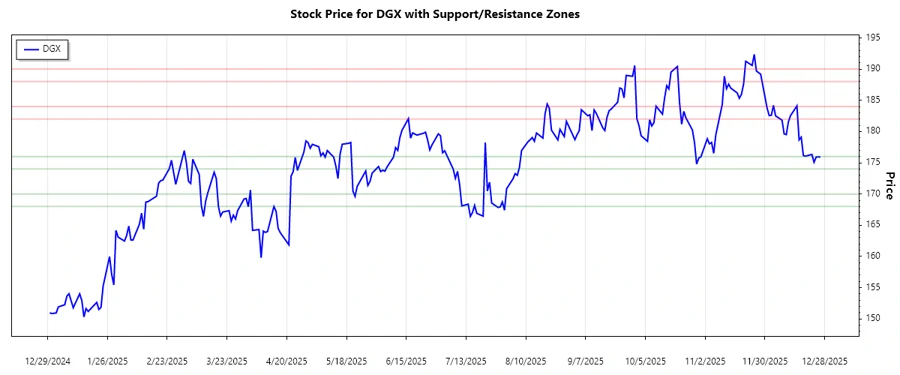
Examining the stock's support and resistance levels helps to identify pivotal zones that can foster trend reversals or validations. The computed zones are:
| Zone Type | From | To |
|---|---|---|
| Support Zone 1 | 174.00 | 176.00 |
| Support Zone 2 | 168.00 | 170.00 |
| Resistance Zone 1 | 182.00 | 184.00 |
| Resistance Zone 2 | 188.00 | 190.00 |
Currently, the stock price is trading near the lower boundary of the first support zone, suggesting caution ahead of potential upward retracement.
Conclusion
The price action in Quest Diagnostics Incorporated reflects a phase of consolidation with short-term volatility. Monitoring the EMA crossover and key support and resistance levels will be critical. Investors should weigh this analysis in relation to macroeconomic variables and sector-specific news, which could influence the stock's trajectory. Consider the tempered short-term optimism against potential market pressures as a decisive factor in future trading strategies.