October 18, 2025 a 02:03 pm
DGX: Trend and Support & Resistance Analysis - Quest Diagnostics Incorporated
Quest Diagnostics Incorporated, renowned for its comprehensive diagnostic services, has displayed interesting patterns in its stock trends lately. With its broad portfolio in diagnostics, the stock's analysis shows signs of stability yet some volatility, reflecting its response to market dynamics. Looking at the recent price movements, there is potential for both short-term risks and opportunities in the stock's technical setup. It's essential to closely monitor upcoming market shifts, as these could impact the stock trajectory significantly.
Trend Analysis
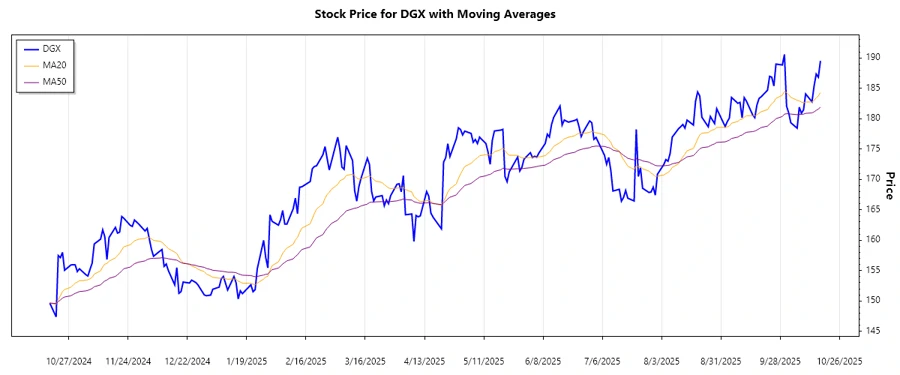
Evaluating the DGX stock data over the last few months, an observable trend has emerged based on the Exponential Moving Averages (EMA). The calculation of EMA20 and EMA50 presents an upward crossover, identifying a bullish trend. With EMA20 surpassing EMA50, the stock shows potential growth in the market.
| Date | Close Price | Trend |
|---|---|---|
| 2025-10-17 | $189.51 | ▲ Uptrend |
| 2025-10-16 | $186.82 | ▲ Uptrend |
| 2025-10-15 | $187.35 | ▲ Uptrend |
| 2025-10-14 | $185.39 | ▼ Downtrend |
| 2025-10-13 | $182.78 | ▼ Downtrend |
| 2025-10-10 | $184.07 | ▲ Uptrend |
| 2025-10-09 | $181.44 | ▼ Downtrend |
Technical analysis suggests a bullish outlook, as indicated by the current upward trajectory. Investors may see this as a continued opportunity for strategic holdings.
Support and Resistance
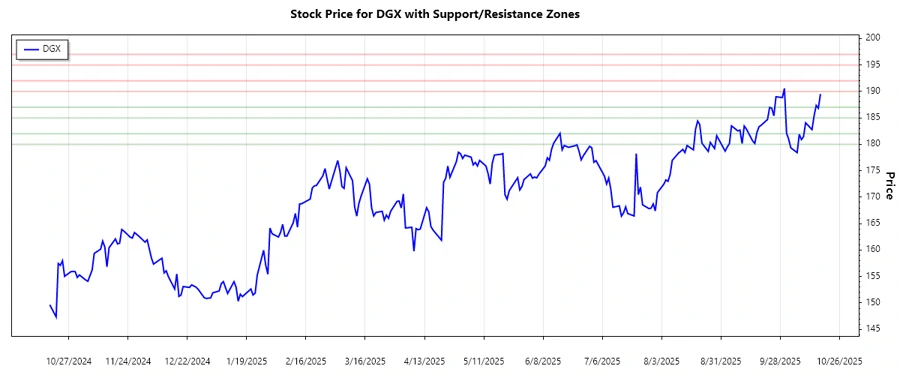
The analysis of support and resistance levels for DGX highlights areas of potential price consolidation and reversal. Identifying crucial zones, the stock indicates strong support at lower levels with significant resistance up above.
| Support & Resistance Zones | Price Range |
|---|---|
| Support Zone 1 | ▲ $180.00 - $182.00 |
| Support Zone 2 | ▲ $185.00 - $187.00 |
| Resistance Zone 1 | ▼ $190.00 - $192.00 |
| Resistance Zone 2 | ▼ $195.00 - $197.00 |
Currently, the stock price is near the lower resistance, indicating potential upward pressure. Should the price break through, it may revert to the next range.
Conclusion
Quest Diagnostics Incorporated has shown a bullish trend, backed by strong support levels. While the stock is in an upward phase, careful monitoring is vital for investors to capitalize on any potential breakouts. The highlighted zones of support and resistance set the stage for strategic entry and exit points. The stock may present lucrative opportunities for traders observing technical markers. While its market stability offers security, the technical analysis also points to possible areas for quick gains.
Smart Data Insight
Master the Perfect Entry & Exit for this Stock
Don't leave your profits to chance. Historically, this stock follows specific seasonal patterns that institutional traders use to maximize returns.
- ✅ Identify the "Golden Buying Window"
- ✅ Avoid high-risk correction cycles
- ✅ Backtested data from the last 20+ years