June 15, 2025 a 03:15 am

DGX: Trend and Support & Resistance Analysis - Quest Diagnostics Incorporated
Quest Diagnostics Incorporated (DGX) shows a recovering trend in its stock performance, indicating potential growth after a phase of consolidation. While testing services remain in demand, market dynamics and competition pose challenges. Carefully observing recent trends, DGX is entering a critical phase of its stock movement, appealing to both value and growth investors.
Trend Analysis
| Date | Closing Price | Trend |
|---|---|---|
| 2025-06-13 | 180.21 | ▲ Up |
| 2025-06-12 | 179.04 | ▲ Up |
| 2025-06-11 | 176.98 | ▲ Up |
| 2025-06-10 | 177.44 | ▲ Up |
| 2025-06-09 | 175.90 | ▲ Up |
| 2025-06-06 | 174.34 | ▲ Up |
| 2025-06-05 | 173.65 | ▲ Up |
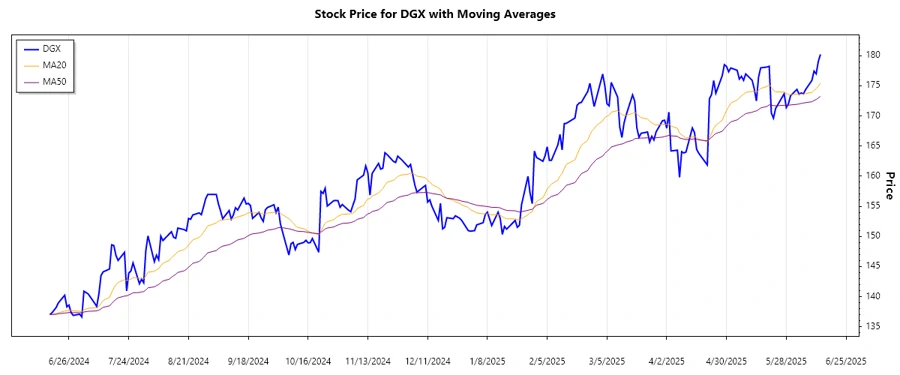
The recent trend in DGX stock is upward as reflected by rising closing prices and EMA20 consistently above EMA50, indicating a strengthening bullish momentum.
Support- and Resistance
| Zone Type | Zone Start | Zone End |
|---|---|---|
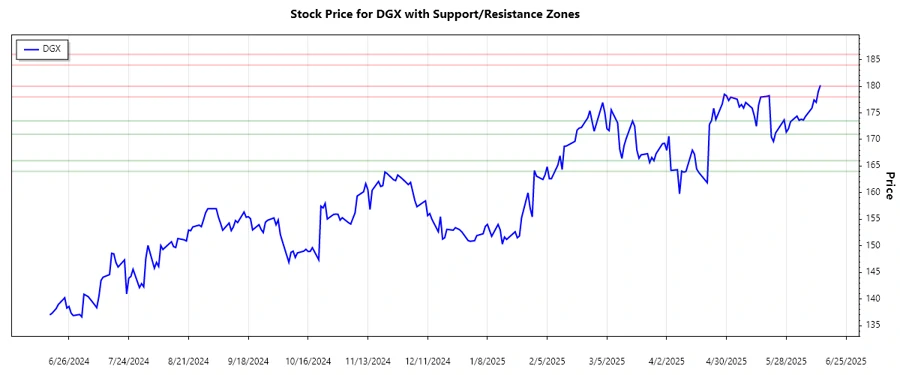
| Support Zone | ▼ 171.00 | ▼ 173.50 |
| Support Zone | ▼ 164.00 | ▼ 166.00 |
| Resistance Zone | ▲ 178.00 | ▲ 180.00 |
| Resistance Zone | ▲ 184.00 | ▲ 186.00 |
Currently, DGX is trading near the lower resistance zone of 178.00 to 180.00, with potential to break into higher levels if the positive momentum continues.
Conclusion
Quest Diagnostics' stock, DGX, is showing signs of a bullish trend after a period of recovery. The recent upward movement suggests potential growth, contingent upon breaking key resistance zones. While challenges exist due to market competition, the demand for diagnostic services supports a positive outlook. Monitoring these support and resistance levels is crucial for both short-term and long-term strategic positioning. Investors should watch for any shifts that could indicate an alteration in the trend, potentially leading to new investment opportunities.