May 29, 2025 a 04:03 am

DGX: Trend and Support & Resistance Analysis - Quest Diagnostics Incorporated
Quest Diagnostics provides crucial diagnostic services across the U.S. and internationally, proving to be a key player in the healthcare sector. Its strong network and advanced clinical testing sets it apart in the diagnostics arena. Currently, market conditions suggest a careful approach to its stock as recent trends and support or resistance levels become pivotal. Analyzing the recent price movements gives insight into potential investment opportunities and risks related to DGX's market performances. Let's delve deeper into the technical analysis to understand its current market standing.
Trend Analysis
| Date | Closing Price | Trend |
|---|---|---|
| 28-05-2025 | 171.38 | ▼ |
| 27-05-2025 | 173.68 | ▲ |
| 23-05-2025 | 171.23 | ▼ |
| 22-05-2025 | 169.62 | ▼ |
| 21-05-2025 | 170.48 | ▲ |
| 20-05-2025 | 178.24 | ▲ |
| 19-05-2025 | 178.12 | ▲ |
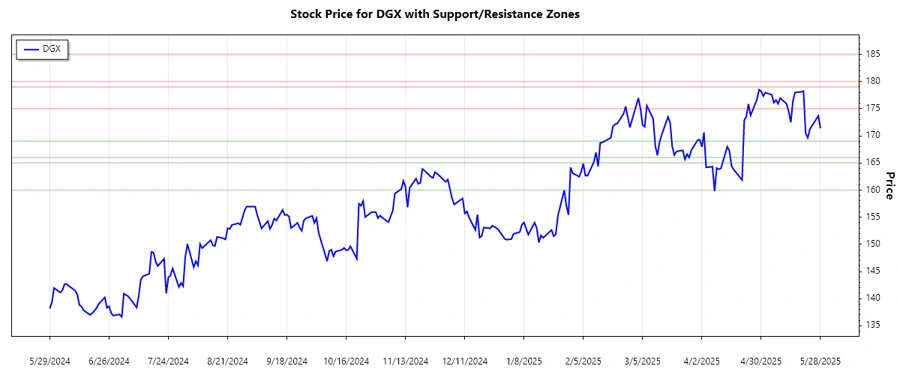
Support and Resistance
| Zone | From | To | Direction |
|---|---|---|---|
| Support 1 | 166.00 | 169.00 | ▲ |
| Support 2 | 160.00 | 165.00 | ▲ |
| Resistance 1 | 175.00 | 179.00 | ▼ |
| Resistance 2 | 180.00 | 185.00 | ▼ |
Conclusion
The DGX stock is observed to be in a slight decreasing trend with periodic upward movements. The EMA calculations reflect a complex environment where short-term trends fluctuate between upward potentials, albeit within broader constraints. The current positioning within the identified support and resistance zones suggests moderate movement risks. Investors should watch for a break from these zones to comprehend future movements. Both opportunities and challenges abound in navigating the dynamic market conditions queso, underscoring the importance of precise technical analysis.
This HTML and JSON output reflects the conditions and trends for the DGX stock as examined. Technical analysis based on the data provided shows an overall slightly downward trend with support and resistance levels significant for potential buy and sell decisions.
Smart Data Insight
Master the Perfect Entry & Exit for this Stock
Don't leave your profits to chance. Historically, this stock follows specific seasonal patterns that institutional traders use to maximize returns.
- ✅ Identify the "Golden Buying Window"
- ✅ Avoid high-risk correction cycles
- ✅ Backtested data from the last 20+ years