
July 04, 2026 a 03:43 pm
DGX: Fundamental Ratio Analysis - Quest Diagnostics Incorporated
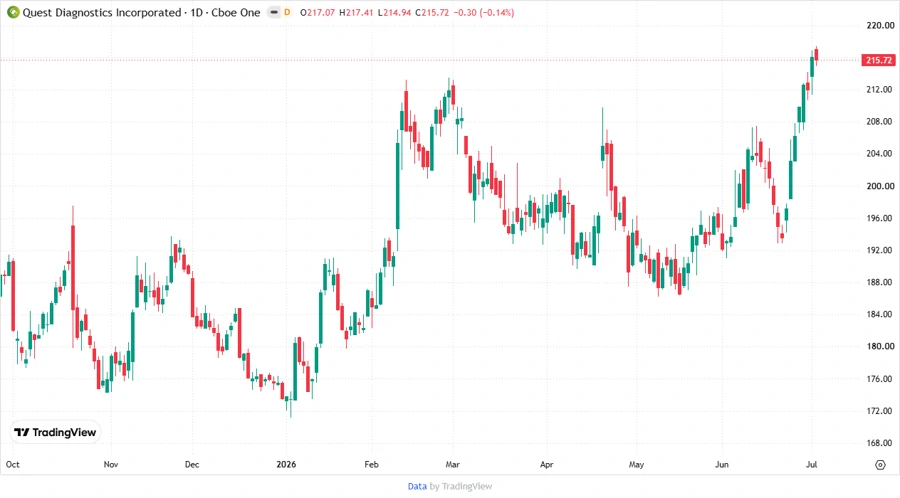
Quest Diagnostics Incorporated, renowned for diagnostic testing, holds a firm position in the healthcare sector. Its robust network and international presence bolster its market stance, although market conditions and industry competition remain challenges. Investors may find value in its consistent performance and strategic expansions.
Fundamental Rating
The fundamental strengths of Quest Diagnostics Incorporated highlight a stable performance, but financial ratios suggest mixed outcomes. Scores are shown below:
| Category | Score | Visualization |
|---|---|---|
| Discounted Cash Flow (DCF) | 4 | |
| Return on Equity (ROE) | 4 | |
| Return on Assets (ROA) | 4 | |
| Debt to Equity | 1 | |
| Price to Earnings (P/E) | 2 | |
| Price to Book (P/B) | 3 |
Historical Rating
The historical evaluation of the stock reflects its progression and past performance trends:
| Date | Overall Score | DCF | ROE | ROA | Debt to Equity | P/E | P/B |
|---|---|---|---|---|---|---|---|
| 2026-07-02 | 3 | 4 | 4 | 4 | 1 | 2 | 3 |
| Previous Date | 0 | 4 | 4 | 4 | 1 | 2 | 3 |
Analyst Price Targets
The stock's estimated price range from analysts provides insights into future valuation expectations:
| High | Low | Median | Consensus |
|---|---|---|---|
| $235 | $210 | $220 | $220.57 |
Analyst Sentiment
Analyst sentiment reflects varied perspectives on DGX, indicating a balanced view:
| Recommendation | Number | Distribution |
|---|---|---|
| Strong Buy | 0 | |
| Buy | 13 | |
| Hold | 18 | |
| Sell | 3 | |
| Strong Sell | 0 |
Conclusion
Quest Diagnostics Incorporated offers strong diagnostic and information services, making it a stable asset in the healthcare industry. While the current market environment poses uncertainties, its consistent financial performance and strategic positioning provide a promising outlook. Though its debt remains a concern, its ability to maintain profitability suggests resilience. Investment in DGX may present moderate returns with managed risks. Investors should weigh these considerations against broader market dynamics.
Smart Data Insight
Master the Perfect Entry & Exit for this Stock
Don't leave your profits to chance. Historically, this stock follows specific seasonal patterns that institutional traders use to maximize returns.
- ✅ Identify the "Golden Buying Window"
- ✅ Avoid high-risk correction cycles
- ✅ Backtested data from the last 20+ years