February 15, 2026 a 12:46 pm


DGX: Dividend Analysis - Quest Diagnostics Incorporated
Quest Diagnostics Incorporated is a noteworthy player in the medical testing industry with a substantial market presence reflected by its market capitalization of over $23 billion. Its commitment to shareholder returns is evidenced by a steady dividend history, marking it as a solid choice for income investors seeking stability and modest dividend growth.
📊 Overview
Quest Diagnostics has maintained a respectable dividend yield alongside a long dividend history without recent cuts. These attributes are appealing to risk-averse investors valuing consistent income.
| Attribute | Value |
|---|---|
| Sector | Healthcare |
| Dividend yield | 1.58% |
| Current dividend per share | 3.18 USD |
| Dividend history | 23 years |
| Last cut or suspension | None |
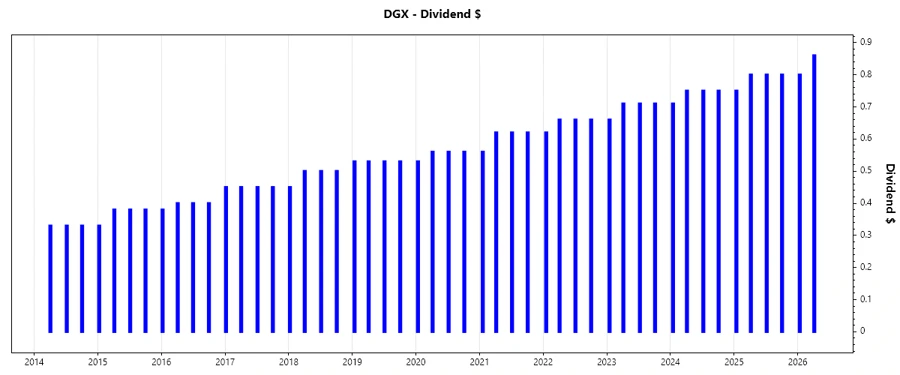
🗣️ Dividend History
Analyzing dividend history provides insights into the company's commitment to return capital to shareholders over many years, a critical indicator of financial health and a positive signal for long-term stakeholders.
| Year | Dividend Per Share |
|---|---|
| 2026 | 1.66 USD |
| 2025 | 3.15 USD |
| 2024 | 2.96 USD |
| 2023 | 2.79 USD |
| 2022 | 2.60 USD |
📈 Dividend Growth
The trajectory of dividend growth serves as a proxy for company health and management's confidence in cash flow sustainability. With moderate but steady growth, investors can anticipate continued incremental increases.
| Time | Growth |
|---|---|
| 3 years | 6.61% |
| 5 years | 7.35% |
The average dividend growth is 7.35% over 5 years. This shows moderate but steady dividend growth.
⚠️ Payout Ratio
A payout ratio indicates how much of earnings is being returned to shareholders as dividends. Quest's ratios suggest strong earnings coverage while maintaining a reasonable proportion of free cash flow reserved.
| Key Figure | Ratio |
|---|---|
| EPS-based | 35.58% |
| Free cash flow-based | 26.03% |
The EPS payout ratio of 35.58% and FCF payout ratio of 26.03% suggest a conservative EPS distribution strategy and efficient free cash flow utilization, leaving room for reinvestment and growth.
✅ Cashflow & Capital Efficiency
Assurances in cash flow stability and capital allocation allow companies to navigate market fluctuations effectively. Evaluating these metrics reveals Quest’s adept management and strategic resource deployment.
| Year | 2025 | 2024 | 2023 |
|---|---|---|---|
| Free Cash Flow Yield | 7.05% | 5.43% | 5.59% |
| Earnings Yield | 5.15% | 5.20% | 5.53% |
| CAPEX to Operating Cash Flow | 27.94% | 31.86% | 32.08% |
| Stock-based Compensation to Revenue | 0.80% | 0.89% | 0.83% |
| Free Cash Flow / Operating Cash Flow Ratio | 72.06% | 68.14% | 67.92% |
The efficient use of free cash flow and stable operating cash flow ratios suggest resilience, enabling continued innovation and investment.
📊 Balance Sheet & Leverage Analysis
Understanding leverage is pivotal for assessing a company's risk and sustainability. Quest Diagnostics demonstrates a balanced approach to leverage, reinforcing confidence in its long-term viability and risk management strategies.
| Year | 2025 | 2024 | 2023 |
|---|---|---|---|
| Debt-to-Equity | 96.50% | 104.56% | 87.17% |
| Debt-to-Assets | 42.64% | 43.87% | 39.21% |
| Debt-to-Capital | 49.11% | 51.11% | 46.57% |
| Net Debt to EBITDA | 3.02 | 3.45 | 2.78 |
| Current Ratio | 1.04 | 1.10 | 1.31 |
| Quick Ratio | 0.96 | 1.02 | 1.20 |
Solid debt management with improving leverage ratios underscores financial discipline and a robust balance sheet.
📈 Fundamental Strength & Profitability
Analyzing profitability and fundamental ratios like ROE and ROA provides insight into efficient capital use, crucial for underlying company strength. Quest’s robust margins underscore strong operational capabilities.
| Year | 2025 | 2024 | 2023 |
|---|---|---|---|
| Return on Equity | 13.84% | 12.85% | 13.54% |
| Return on Assets | 6.11% | 5.39% | 6.09% |
| Net Margin | 8.99% | 8.82% | 9.23% |
| Gross Margin | 31.93% | 32.86% | 33.17% |
| EBIT Margin | 14.34% | 14.19% | 13.98% |
| Research & Development to Revenue | 0% | 0% | 0% |
The solid profitability metrics suggest effective cost management and impressive capital efficiencies, indicative of long-term growth capability.
📊 Price Development
✅ Dividend Scoring System
| Criteria | Score (1-5) | Bar |
|---|---|---|
| Dividend yield | 3 | |
| Dividend Stability | 5 | |
| Dividend growth | 4 | |
| Payout ratio | 4 | |
| Financial stability | 4 | |
| Dividend continuity | 5 | |
| Cashflow Coverage | 3 | |
| Balance Sheet Quality | 4 |
Total Score: 32 out of 40
🗣️ Rating
Quest Diagnostics Incorporated presents a compelling investment opportunity, especially for conservative dividend-seeking investors. With stable returns, robust financial metrics, and prudent cash flow management, it is poised for sustainable growth.
Smart Data Insight
Master the Perfect Entry & Exit for this Stock
Don't leave your profits to chance. Historically, this stock follows specific seasonal patterns that institutional traders use to maximize returns.
- ✅ Identify the "Golden Buying Window"
- ✅ Avoid high-risk correction cycles
- ✅ Backtested data from the last 20+ years