
July 12, 2026 a 01:15 pm
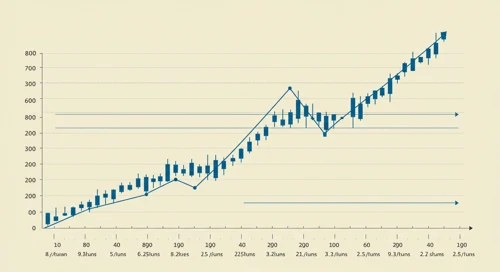


DE: Trend and Support & Resistance Analysis - Deere & Company
The recent data indicates a notable trend in Deere & Company's stock performance. With a significant presence in agriculture and construction machinery, Deere & Company has demonstrated resilience amidst market fluctuations. Examining the moving averages, we can assess the current trend dynamics and evaluate strategic support and resistance levels. The analysis aims to provide insights into the potential opportunities and risks associated with this stock's current performance.
Trend Analysis
The analysis of Deere & Company's recent price data reveals significant insights. By calculating the Exponential Moving Averages (EMA) from the closing prices, we observe the EMA20 and EMA50 to determine the current trend.
| Date | Closing Price | Trend |
|---|---|---|
| 2026-07-10 | 586.86 | ▼ |
| 2026-07-09 | 592.9 | ▼ |
| 2026-07-08 | 596.74 | ▼ |
| 2026-07-07 | 603.61 | ▼ |
| 2026-07-06 | 635.24 | ▲ |
| 2026-07-02 | 621.27 | ▼ |
| 2026-07-01 | 627.63 | ► |
The recent decline in EMA20 below EMA50 indicates a ▼ downtrend, suggesting potential bearish sentiments in the market.
Support and Resistance Analysis
In evaluating recent price movements, two key support and resistance zones have been identified. These zones are calculated from the observed historical price action.
| Zone Type | From | To |
|---|---|---|
| Support Zone 1 | 560.05 | 577.33 |
| Support Zone 2 | 577.48 | 585.29 |
| Resistance Zone 1 | 591.75 | 600.75 |
| Resistance Zone 2 | 606.04 | 613.24 |
The current price remains slightly below the nearest resistance level, indicating a possible challenge in breaking higher unless buying pressure increases.
Conclusion
The analysis of Deere & Company's stock reveals a defining period of downward pressure as indicated by declining EMAs. Despite the recent bearish trend, the established support zones provide potential safety nets that may curb further declines. The presence of resistance levels suggests hurdles for upward momentum, but breakthroughs could indicate bullish opportunities. Investors should factor in market conditions and sector dynamics when considering positions in this stock, balancing risk with potential growth.
Smart Data Insight
Master the Perfect Entry & Exit for this Stock
Don't leave your profits to chance. Historically, this stock follows specific seasonal patterns that institutional traders use to maximize returns.
- ✅ Identify the "Golden Buying Window"
- ✅ Avoid high-risk correction cycles
- ✅ Backtested data from the last 20+ years