September 06, 2025 a 02:03 pm


DE: Trend and Support & Resistance Analysis - Deere & Company
Deere & Company shows a vibrant trend indicative of investor confidence in its strong market positioning, particularly in the agricultural equipment sector. With technological advancements in their precision agriculture segment, they are anticipated to continue performing robustly. However, potential market volatility and fluctuating commodity prices might present challenges.
Trend Analysis
| Date | Close Price | Trend |
|---|---|---|
| 2025-09-05 | 473.26 | ▼ Abwärtstrend |
| 2025-09-04 | 474.90 | ▼ Abwärtstrend |
| 2025-09-03 | 469.52 | ▼ Abwärtstrend |
| 2025-09-02 | 476.78 | ▼ Abwärtstrend |
| 2025-08-29 | 478.64 | ▼ Abwärtstrend |
| 2025-08-28 | 491.44 | ▲ Aufwärtstrend |
| 2025-08-27 | 493.08 | ▲ Aufwärtstrend |
The recent market data reveals a noticeable downward trend driven by decreasing prices over consecutive days. Signs of potential reversal are subtle but present, indicating a fleeting upward momentum that didn't persist. Attention towards breaking external factors may guide short-term movements.
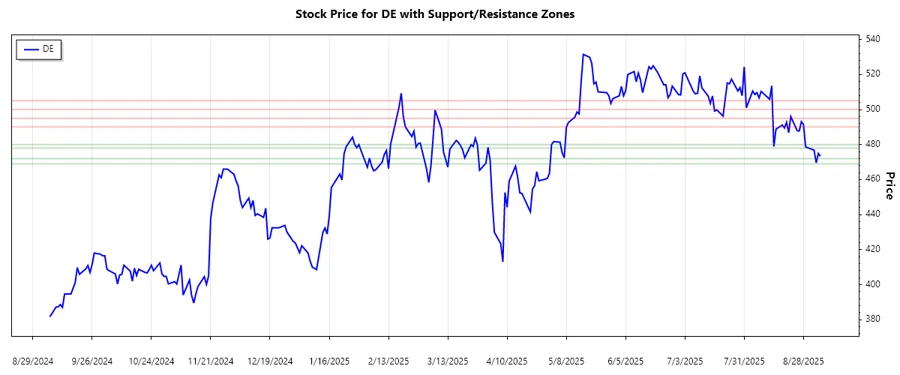
Support- and Resistance
| Zone | From | To |
|---|---|---|
| Support 1 | 469.00 | 472.00 |
| Support 2 | 478.00 | 480.00 |
| Resistance 1 | 490.00 | 495.00 |
| Resistance 2 | 500.00 | 505.00 |
At present, the price is hovering near the support zone of 469.00 to 472.00. If this support holds, it could provide a base for a potential recovery. Movement above immediate resistance could be indicative of bullish trends. Continuously fluctuating prices necessitate vigilant observation.
Conclusion
The current technical outlook for Deere & Company indicates persisting bearish pressure, though key support levels provide a cushion for potential rebounds, essential for sustainable investor sentiment. Price fluctuations within established zones necessitate strategic analysis for prospective gains. A cautious approach is warranted, especially as external economic influences may inherently impact the commodity equipment sectors.
json This structured analysis provides insights into DE's stock performance using technical trends and support/resistance zones. The EMA-based trend analysis guides short-term movements, while support and resistance zones establish key market barriers. Prospective investors should interpret these findings with an understanding of broader market conditions impacting Deere & Company's stock price.
Smart Data Insight
Master the Perfect Entry & Exit for this Stock
Don't leave your profits to chance. Historically, this stock follows specific seasonal patterns that institutional traders use to maximize returns.
- ✅ Identify the "Golden Buying Window"
- ✅ Avoid high-risk correction cycles
- ✅ Backtested data from the last 20+ years