February 23, 2026 a 03:15 pm

DE: Fibonacci Analysis - Deere & Company
Deere & Company has demonstrated robustness in its stock performance, driven by strong fundamentals in the agricultural and construction sectors. Over the past several months, the stock has been on an upward trajectory, reflecting positive market sentiment and strategic business growth. This suggests a favourable investment outlook, although market volatility can prompt short-term fluctuations.
Fibonacci Analysis
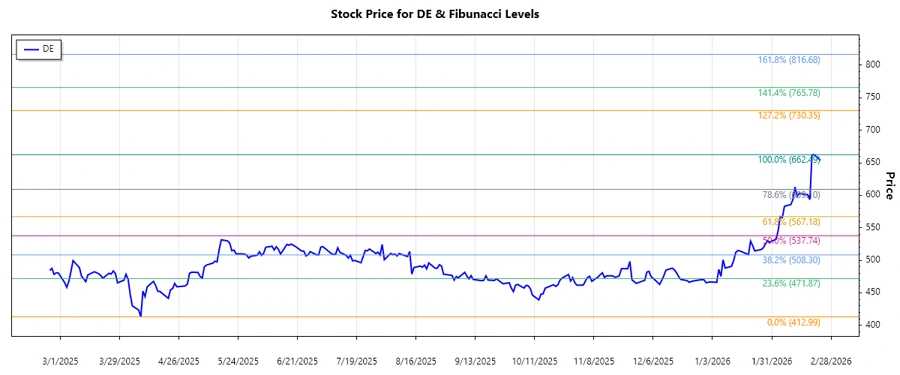
The analysis of historical price data for Deere & Company indicates a dominant upward trend. The following table summarizes the key Fibonacci retracement levels calculated from the high and low prices observed over the analyzed period:
| Start Date | End Date | High Price & Date | Low Price & Date | 0.236 Level | 0.382 Level | 0.5 Level | 0.618 Level | 0.786 Level |
|---|---|---|---|---|---|---|---|---|
| 2025-08-12 | 2026-02-19 | $662.49 on 2026-02-20 | $412.99 on 2025-04-08 | $527.51 | $572.71 | $600.45 | $628.20 | $648.81 |
The current price is $653.74, placing it within the 0.786 retracement zone. Technically, this suggests a strong resistance level near the recent highs, indicating potential challenges for further upward movement unless there is significant momentum.
Conclusion
Deere & Company's stock has shown solid growth over recent months, primarily driven by the company's strong market position and sectoral demand. The Fibonacci retracement analysis indicates possible resistance levels, with the current price nearing the higher retracement zones. Analysts should watch for potential breakout signals or market catalysts that could either push the price above the resistance or lead to a reversal. Careful monitoring is recommended to leverage emerging opportunities or mitigate risks associated with fluctuating market conditions.