May 15, 2026 a 03:31 pm
Dividend Analysis - Deere & Company
Deere & Company, a stalwart in the agricultural equipment sector, delivers a steady dividend yield coupled with a long history of dividend continuity. With over five decades of unbroken dividend payments, Deere showcases resilience and reliability. Investors should appreciate its moderate but consistent dividend growth, although attention must be paid to its leveraged balance sheet.
📊 Overview
Deere & Company operates primarily in the machinery sector, offering indispensable products to the agricultural industry. Its 1.15% dividend yield and a solid history of 55 years of uninterrupted payments exemplify its commitment to returning value to shareholders. No recent cuts or suspensions make it an appealing choice for income-focused investors.
| Key Aspect | Details |
|---|---|
| Sector | Machinery |
| Dividend yield | 1.15% |
| Current dividend per share | $6.35 |
| Dividend history | 55 years |
| Last cut or suspension | None |
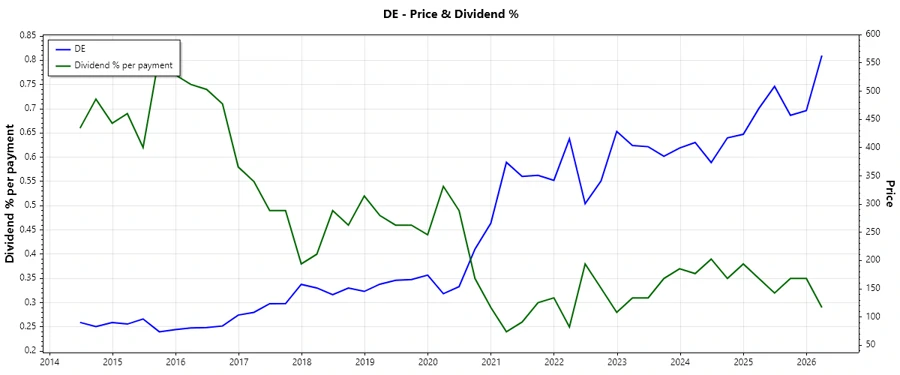
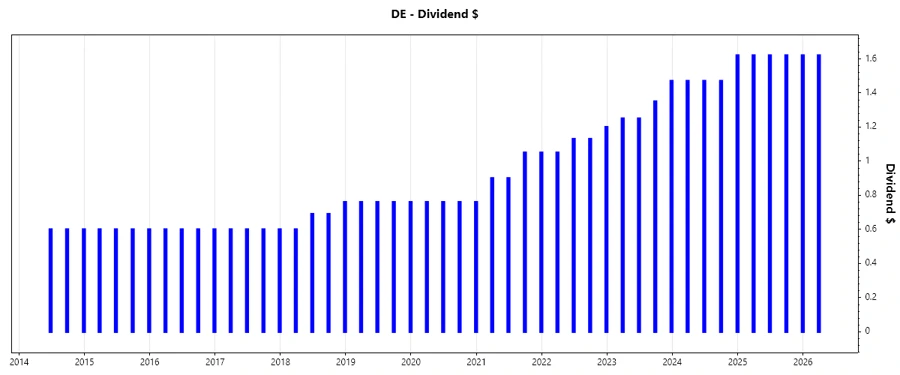
📉 Dividend History
Understanding the historical dividend payments reveals a commitment to shareholder value and stability. Sustainable dividend increases indicate a company's ability to generate steady cash flow and profit, thereby maintaining investor confidence.
| Year | Dividend Per Share (USD) |
|---|---|
| 2026 | $1.62 |
| 2025 | $6.48 |
| 2024 | $6.03 |
| 2023 | $5.32 |
| 2022 | $4.51 |
📈 Dividend Growth
Dividend growth is a key indicator of a company's future dividend paying capacity. Deere's growth of 12.84% over three years and 16.34% over five years highlights its ability to consistently increase dividend payouts.
| Time | Growth |
|---|---|
| 3 years | 12.84% |
| 5 years | 16.34% |
The average dividend growth is 16.34% over 5 years. This shows moderate but steady dividend growth.
✅ Payout Ratio
The payout ratio measures the sustainability of dividend payments by comparing them to earnings. Deere's payout ratio indicates a strategic level, balancing dividend payments with reinvestment back into the company.
| Key figure | Ratio |
|---|---|
| EPS-based | 35.65% |
| Free cash flow-based | 47.96% |
Deere's EPS-based payout ratio of 35.65% and FCF-based payout ratio of 47.96% suggest a robust capacity to maintain and potentially increase dividend payouts while supporting other corporate initiatives.
⚠️ Cashflow & Capital Efficiency
The ability to generate cash flow and efficiently deploy capital is critical for ensuring dividend stability and growth. Deere's historical data offers insight into its operational efficiency and capital management.
| Year | 2025 | 2024 | 2023 |
|---|---|---|---|
| Free Cash Flow Yield | 2.58% | 3.89% | 3.83% |
| Earnings Yield | 4.02% | 6.24% | 9.46% |
| CAPEX to Operating Cash Flow | 0.5668 | 0.5202 | 0.5202 |
| Stock-based Compensation to Revenue | 0% | 0.41% | 0.21% |
| Free Cash Flow / Operating Cash Flow Ratio | 43.31% | 47.98% | 47.98% |
Deere effectively converts a significant portion of its operating cash into free cash flow, implying solid operational efficiency and potential for continued dividend support.
🗣️ Balance Sheet & Leverage Analysis
The balance sheet provides insights into a company's ability to manage its obligations and leverage its resources, crucial for its long-term operational health and investor confidence.
| Year | 2025 | 2024 | 2023 |
|---|---|---|---|
| Debt-to-Equity | 2.46 | 2.87 | 2.92 |
| Debt-to-Assets | 0.60 | 0.61 | 0.61 |
| Debt-to-Capital | 0.71 | 0.74 | 0.75 |
| Net Debt to EBITDA | 4.77 | 3.96 | 3.22 |
| Current Ratio | 2.31 | 2.13 | 1.96 |
| Quick Ratio | 2.08 | 1.94 | 1.75 |
| Financial Leverage | 4.08 | 4.69 | 4.78 |
Deere's high leverage ratios indicate potential financial strain but also a willingness to capitalize on growth opportunities. Its robust current and quick ratios imply reassuring liquidity levels.
🗣️ Fundamental Strength & Profitability
The profitability metrics reflect a company's ability to generate earnings as relative to its sales, assets, and equity, indicating operational efficiency and risk management.
| Year | 2025 | 2024 | 2023 |
|---|---|---|---|
| Return on Equity | 19.37% | 31.09% | 46.67% |
| Return on Assets | 4.74% | 6.62% | 9.77% |
| Margins: Net | 11.25% | 14.05% | 16.87% |
| Margins: EBIT | 21.11% | 24.85% | 25.68% |
| Margins: EBITDA | 26.10% | 29.04% | 29.01% |
| Margins: Gross | 36.48% | 38.59% | 37.02% |
| Research & Development to Revenue | 5.17% | 4.53% | 3.61% |
Deere's strong profitability ratios, coupled with its investment in R&D, demonstrate its capability to sustain competitive advantage and drive continued innovation and growth.
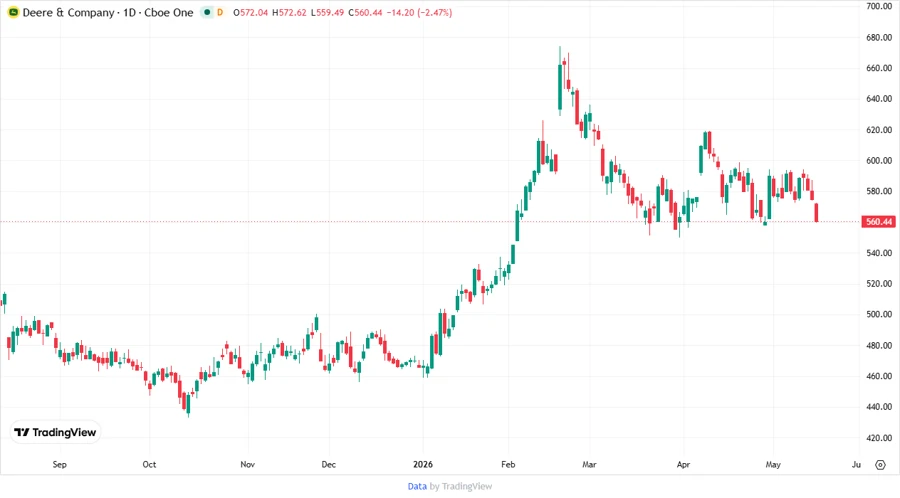
Price Development
Dividend Scoring System
| Criteria | Score (1-5) | Score Bar |
|---|---|---|
| Dividend yield | 3 | |
| Dividend Stability | 5 | |
| Dividend growth | 4 | |
| Payout ratio | 4 | |
| Financial stability | 3 | |
| Dividend continuity | 5 | |
| Cashflow Coverage | 4 | |
| Balance Sheet Quality | 3 |
Overall Score: 31 out of 40
Rating
Deere & Company stands as a reliable dividend contender with robust historical yields and consistent growth. The company's strategic investments and cash flow generation capability position it well for future increases, though its leverage deserves monitoring. Overall, it offers a balanced opportunity for income and modest growth-oriented investors.
Smart Data Insight
Master the Perfect Entry & Exit for this Stock
Don't leave your profits to chance. Historically, this stock follows specific seasonal patterns that institutional traders use to maximize returns.
- ✅ Identify the "Golden Buying Window"
- ✅ Avoid high-risk correction cycles
- ✅ Backtested data from the last 20+ years