March 18, 2026 a 07:31 am
📊 Dividend Analysis - Deere & Company
Deere & Company, renowned for its industrial machinery, offers a stable dividend with its significant history of increasing dividends over 55 years. However, the current yield of 1.13% is modest, highlighting its primary strength in dividend growth consistency. The company showcases a robust retention strategy, yet opportunities for enhancing dividend yield remain an area for exploration. Let's delve into the specifics below.
🔍 Overview
Deere & Company is a pillar in the industrial machinery sector demonstrating a steadfast dividend policy with a history of 55 uninterrupted years. Despite a moderate dividend yield of 1.13%, their well-supported dividends signal consistent generosity towards shareholders.
| Aspect | Detail |
|---|---|
| Sector | Industrial Machinery |
| Dividend yield | 1.13% |
| Current dividend per share | $6.35 USD |
| Dividend history | 55 years |
| Last cut or suspension | None |
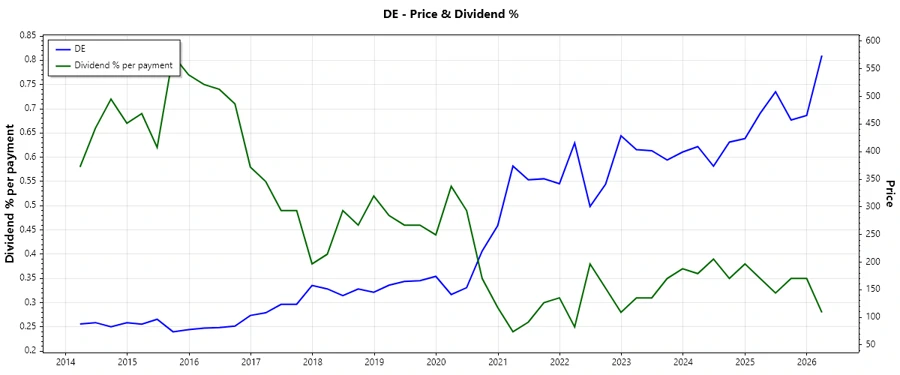
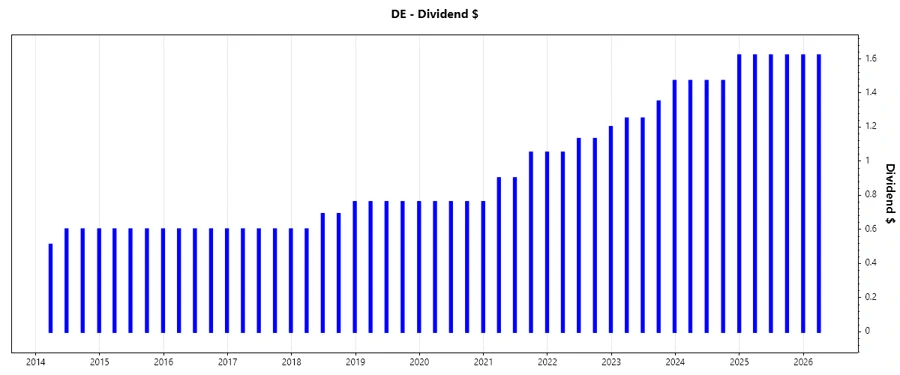
🗂️ Dividend History
Deere's commitment to its dividends is underscored by a comprehensive history of dividend consistency. This longevity reflects not only historical shareholder wealth returns but also a legacy of financial prudence.
| Year | Dividend per share (USD) |
|---|---|
| 2026 | 1.62 |
| 2025 | 6.48 |
| 2024 | 6.03 |
| 2023 | 5.32 |
| 2022 | 4.51 |
📈 Dividend Growth
The growth of dividends over time reveals emphasis on shareholder return. A moderate dividend growth rate of approximately 16.34% over five years implies prudent financial management focused on long-term stability and gradual shareholder value enhancement.
| Time | Growth |
|---|---|
| 3 years | 12.84% |
| 5 years | 16.34% |
The average dividend growth is 16.34% over 5 years. This shows moderate but steady dividend growth.
💰 Payout Ratio
Deere & Company's payout ratio is a pivotal indicator of its dividend sustainability. The EPS-based payout ratio of 35.65% and an FCF-based ratio of 47.96% suggest a disciplined approach ensuring cash reserves for growth, signaling excellent dividend safety without compromising operational reinvestment capabilities.
| Key figure | Ratio |
|---|---|
| EPS-based | 35.65% |
| Free cash flow-based | 47.96% |
The EPS and FCF payout ratios suggest a strong dividend coverage capacity, illustrating robust earning retention for growth.
🌊 Cashflow & Capital Efficiency
Monitoring cash flow and capital efficiency is imperative for sustainable growth. Deere exhibits a free cash flow yield of 2.3% and earnings yield of 3.1%, demonstrating healthy conversion of revenue into free cash flow efficiently supporting investment needs.
| Aspect | 2023 | 2024 | 2025 |
|---|---|---|---|
| Free Cash Flow Yield | 3.83% | 3.89% | 2.58% |
| Earnings Yield | 9.46% | 6.24% | 4.02% |
| CAPEX to Operating Cash Flow | 52.02% | 52.02% | 56.68% |
| Stock-based Compensation to Revenue | 0.22% | 0.41% | 0% |
| Free Cash Flow / Operating Cash Flow Ratio | 47.98% | 47.98% | 43.32% |
The data corroborates Deere's capital efficiency and operational cash flow stability, crucial for supporting dividends and investment capabilities.
⚖️ Balance Sheet & Leverage Analysis
Deere & Company's balance sheet showcases strategic leverage with a Debt-to-Equity ratio of approximately 2.46x, underlined by a net debt to EBITDA of 4.82, ensuring optimized capital structure for growth with mindful risk management.
| Aspect | 2023 | 2024 | 2025 |
|---|---|---|---|
| Debt-to-Equity | 2.92 | 2.87 | 2.46 |
| Debt-to-Assets | 0.61 | 0.61 | 0.60 |
| Debt-to-Capital | 0.75 | 0.74 | 0.71 |
| Net Debt to EBITDA | 3.22 | 3.96 | 4.82 |
| Current Ratio | 1.96 | 2.13 | 2.31 |
| Quick Ratio | 1.75 | 1.93 | 2.08 |
| Financial Leverage | 4.78 | 4.70 | 4.08 |
Overall, the ratios highlight Deere's strategic use of leverage, while maintaining liquidity, thus boosting investor confidence.
🏗️ Fundamental Strength & Profitability
Evaluating fundamental strength ensures assessing long-term corporate health. Deere's ROE of 18.93% in 2025 underlines effective profit utilization for equity holders. Margins showcase robust operational profitability.
| Aspect | 2023 | 2024 | 2025 |
|---|---|---|---|
| Return on Equity | 46.67% | 31.09% | 19.37% |
| Return on Assets | 9.77% | 6.62% | 4.74% |
| Net Margin | 16.87% | 14.05% | 11.25% |
| EBIT Margin | 25.68% | 24.85% | 21.11% |
| EBITDA Margin | 29.01% | 29.04% | 26.10% |
| Gross Margin | 37.02% | 38.59% | 36.48% |
| Research & Development to Revenue | 3.61% | 4.53% | 5.17% |
Profit margins and returns reflect strategic cost management and innovation-focus, driving high shareholder value returns.
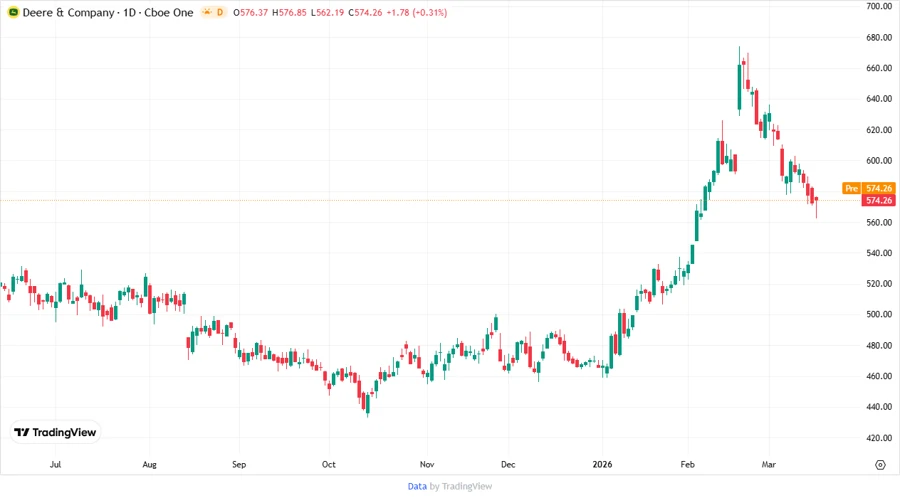
🤑 Price Development
🏅 Dividend Scoring System
| Aspect | Score (1-5) | |
|---|---|---|
| Dividend yield | 2 | |
| Dividend Stability | 5 | |
| Dividend growth | 4 | |
| Payout ratio | 4 | |
| Financial stability | 3 | |
| Dividend continuity | 5 | |
| Cashflow Coverage | 3 | |
| Balance Sheet Quality | 4 |
Total Score: 30/40
📊 Rating & Recommendation
Deere & Company exemplifies substantial dividend stability and growth potential, especially due to its history and strategic financial management. While yield may not be a standout, its growth and reliability position it as a strong prospect for long-term dividend-seeking investors. Further increases in dividend yield could enhance overall attractiveness.
Smart Data Insight
Master the Perfect Entry & Exit for this Stock
Don't leave your profits to chance. Historically, this stock follows specific seasonal patterns that institutional traders use to maximize returns.
- ✅ Identify the "Golden Buying Window"
- ✅ Avoid high-risk correction cycles
- ✅ Backtested data from the last 20+ years