August 13, 2025 a 07:46 am


Dividend Analysis - Deere & Company
Deere & Company has a notable history of consistent dividend payouts, reflecting its commitment to returning capital to shareholders. With a significant market presence, Deere is positioned in the industrial sector, indicating a stable high-demand industry. The company’s current dividend metrics highlight both opportunities for stable income and potential growth.
📊 Overview
The dividend profile of Deere & Company is robust, showcasing a combination of defensive income potential with moderate growth prospects. This long-term commitment to dividend stability is among the most attractive features for conservative dividend investors.
| Parameter | Details |
|---|---|
| Sector | Industrial |
| Dividend yield | 1.24% |
| Current dividend per share | 5.82 USD |
| Dividend history | 54 years |
| Last cut or suspension | None |
📈 Dividend History
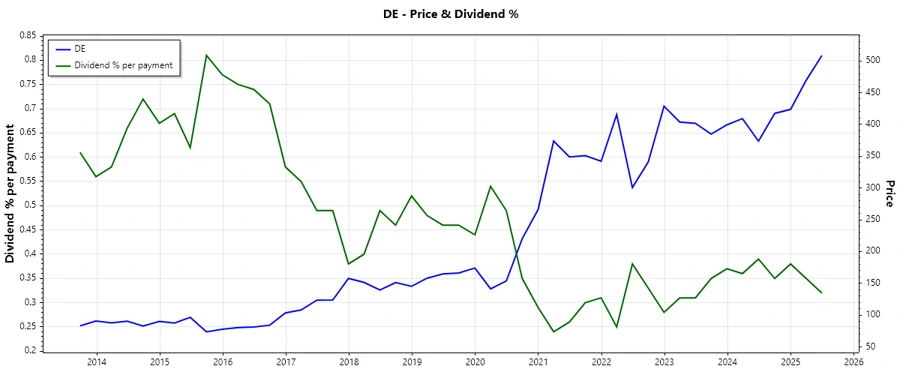
Understanding the historical trend of dividends provides insight into a company's consistency and reliability in rewarding shareholders. For Deere, a long-standing history of increasing dividends is evident, showcasing both stability and investor confidence.
| Year | Dividend Per Share (USD) |
|---|---|
| 2025 | 3.24 |
| 2024 | 6.03 |
| 2023 | 5.32 |
| 2022 | 4.51 |
| 2021 | 3.90 |
📉 Dividend Growth
Dividend growth analysis is imperative for projecting future income potential. It underscores a company's ability to generate favorable shareholder returns through capital appreciation and income growth.
| Time | Growth |
|---|---|
| 3 years | 15.63% |
| 5 years | 14.68% |
The average dividend growth is 14.68% over 5 years. This shows moderate but steady dividend growth, reinforcing shareholder value and commitment to company profit redistribution.
✅ Payout Ratio
Payout ratios ground an investor in understanding how much of a company’s earnings or cash flow is being committed to shareholder dividends. Healthy ratios often imply less risk of future dividend cuts.
| Key Figure | Ratio |
|---|---|
| EPS-based | 27.89% |
| Free cash flow-based | 36.36% |
The payout ratios, namely 27.89% (EPS) and 36.36% (FCF), indicate strong coverage and sustainable dividend strategies. This further solidifies Deere's financial prudence and stability in profit allocation.
🗣️ Cashflow & Capital Efficiency
Cash flow dynamics are crucial in assessing operational effectiveness and funding dividend payouts without leverage. Efficiency metrics such as return on invested capital signal optimized capital allocation.
| Year | 2024 | 2023 | 2022 |
|---|---|---|---|
| Free Cash Flow Yield | 3.89% | 3.83% | 0.76% |
| Earnings Yield | 6.24% | 9.46% | 5.92% |
| CAPEX to Operating Cash Flow | 52.02% | 52.02% | 80.61% |
| Stock-based Compensation to Revenue | 0.40% | 0.21% | 0.16% |
| Free Cash Flow / Operating Cash Flow | 47.98% | 47.98% | 19.39% |
The cash flow matrix accentuates a robust operational cushion to manage expenditures, dividends, and expansion agendas. Strong capital efficiency underpins superior shareholder return potential.
⚠️ Balance Sheet & Leverage Analysis
A comprehensive assessment of leverage ratios provides insight into the company’s risk profile and financial durability under varied economic conditions. Liquidity ratios forecast short-term financial health.
| Year | 2024 | 2023 | 2022 |
|---|---|---|---|
| Debt-to-Equity | 286.67% | 292.37% | 257.63% |
| Debt-to-Assets | 61.00% | 61.19% | 57.98% |
| Debt-to-Capital | 74.14% | 74.51% | 72.04% |
| Net Debt to EBITDA | 5.12 | 3.69 | 4.11 |
| Current Ratio | 2.13 | 1.96 | 2.02 |
| Quick Ratio | 1.94 | 1.75 | 1.75 |
| Financial Leverage | 4.70 | 4.78 | 4.44 |
Deere's balance sheet manifests a well-managed debt footprint proportionate to equity and assets, which commands prudent placement within long-term financial strategies.
🧮 Fundamental Strength & Profitability
Profitability ratios illustrate the strength of operational performance and overall economic health. These numbers reflect management efficiency in converting sales into profits.
| Year | 2024 | 2023 | 2022 |
|---|---|---|---|
| Return on Equity | 31.09% | 46.67% | 35.19% |
| Return on Assets | 6.62% | 9.77% | 7.92% |
| Margins: Net | 13.78% | 16.61% | 13.57% |
| Margins: EBIT | 18.26% | 21.88% | 18.57% |
| Margins: EBITDA | 22.02% | 24.92% | 22.00% |
| Margins: Gross | 29.50% | 30.63% | 27.39% |
| R&D to Revenue | 4.44% | 3.56% | 3.64% |
The solid profitability metrics represent efficient resource management and uphold Deere's dominance within its sector. Strong R&D investment ensures sustained innovation and market relevance.
📉 Price Development
🗳️ Dividend Scoring System
| Category | Score | Bar |
|---|---|---|
| Dividend Yield | 3 | |
| Dividend Stability | 5 | |
| Dividend Growth | 4 | |
| Payout Ratio | 5 | |
| Financial Stability | 4 | |
| Dividend Continuity | 5 | |
| Cashflow Coverage | 3 | |
| Balance Sheet Quality | 4 |
Total Score: 33/40
📈 Rating
Deere & Company is a strong candidate for dividend-focused investors, demonstrating exemplary financial health and a commendable dividend history. While the current yield is modest, the company's consistent growth and high stability make it a reliable choice for long-term income generation.
Smart Data Insight
Master the Perfect Entry & Exit for this Stock
Don't leave your profits to chance. Historically, this stock follows specific seasonal patterns that institutional traders use to maximize returns.
- ✅ Identify the "Golden Buying Window"
- ✅ Avoid high-risk correction cycles
- ✅ Backtested data from the last 20+ years