WMT: Analysts Ratings - Walmart Inc
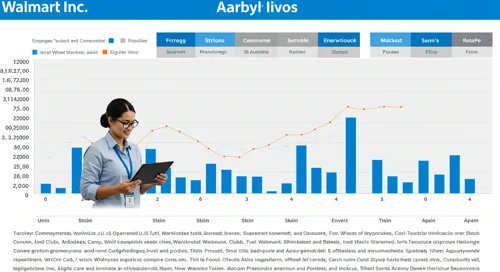
WMT: Comprehensive breakdown of current and historical analyst ratings, offering insights into how expert sentiment has evolved over time.
May 30, 2026 a 09:00 am
KDP: Analysts Ratings - Keurig Dr Pepper Inc

KDP: Comprehensive breakdown of current and historical analyst ratings, offering insights into how expert sentiment has evolved over time.
May 30, 2026 a 08:38 am
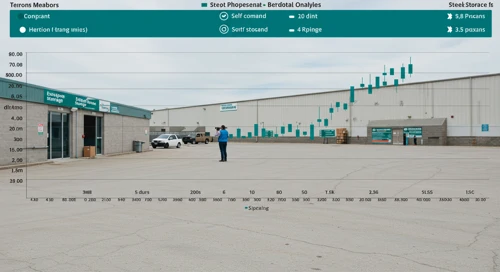
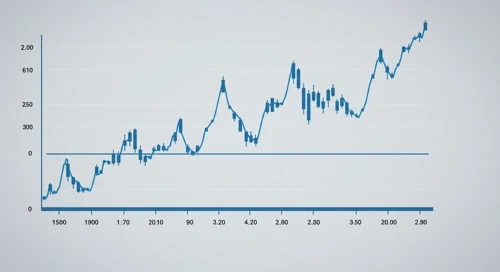
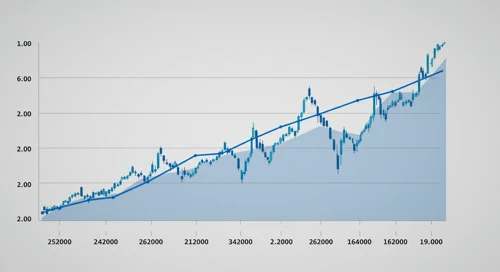
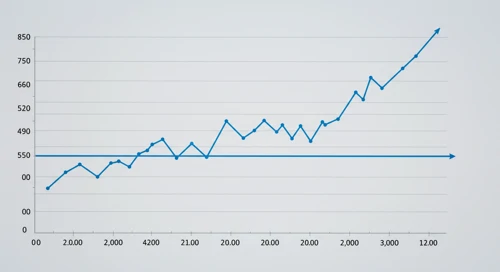
D: Trend with Support and Resistance Levels - Dominion Energy Inc
D: Current price trend is evaluated alongside key support and resistance level. View of potential turning points and price momentum.
May 30, 2026 a 08:15 am
UNH: Fundamental Ratio Analysis - UnitedHealth Group Incorporated

UNH: Evaluation of key financial ratios, analyst ratings, and price targets. A data-driven perspective on the valuation and market expectations.
May 30, 2026 a 08:00 am
HST: Dividend Analysis - Host Hotels and Resorts Inc

HST: In-depth analysis of a company's dividend stability and key fundamental ratios to assess its financial strength and long-term investment potential.
May 30, 2026 a 07:46 am
EQR: Fundamental Ratio Analysis - Equity Residential

EQR: Evaluation of key financial ratios, analyst ratings, and price targets. A data-driven perspective on the valuation and market expectations.
May 30, 2026 a 07:43 am
CAG: Dividend Analysis - Conagra Brands Inc
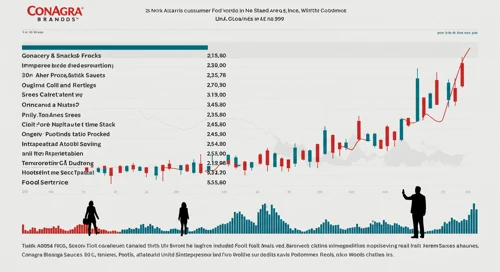
CAG: In-depth analysis of a company's dividend stability and key fundamental ratios to assess its financial strength and long-term investment potential.
May 30, 2026 a 07:31 am

GOOG: Fibunacci Level Technical Analysis - Alphabet Inc
May 30, 2026 a 11:44 am
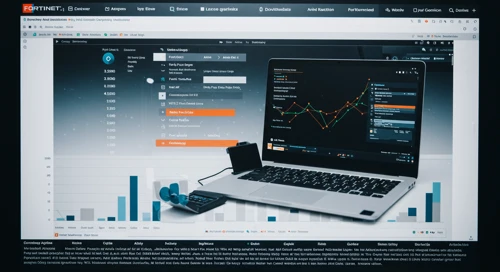
FTNT: Fundamental Ratio Analysis - Fortinet Inc
May 30, 2026 a 11:43 am
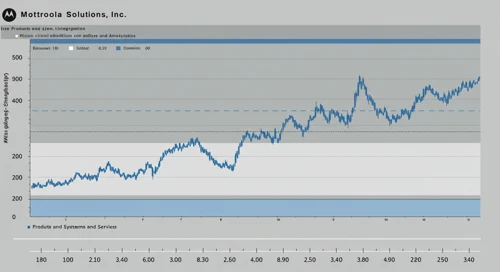
MSI: Fibunacci Level Technical Analysis - Motorola Solutions Inc
May 30, 2026 a 10:15 am

Industrial Comparison. 30 May
May 30, 2026 a 09:31 am
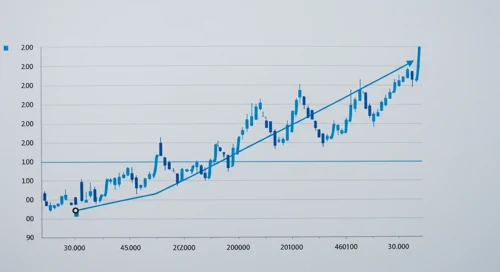
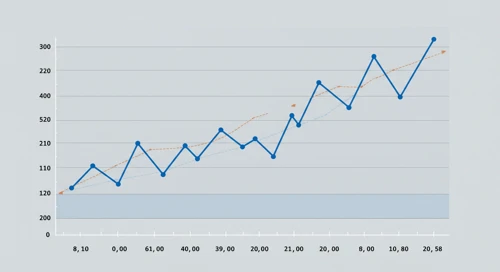
ED: Fibunacci Level Technical Analysis - Consolidated Edison Inc

ED: Fibonacci retracement levels to identify key potential support and resistance zones, based on recent price trends.
May 30, 2026 a 06:44 am
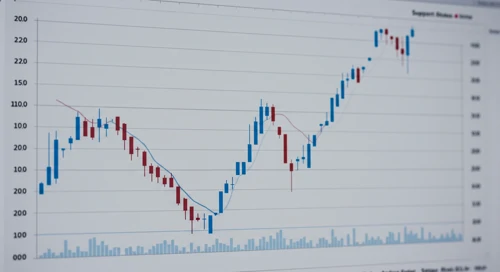
CHRW: Fibunacci Level Technical Analysis - CH Robinson Worldwide Inc

CHRW: Fibonacci retracement levels to identify key potential support and resistance zones, based on recent price trends.
May 30, 2026 a 05:15 am
EURUSD: Fibunacci Level Technical Analysis
EURUSD: Fibonacci retracement levels to identify key potential support and resistance zones, based on recent price trends.
May 30, 2026 a 05:08 am
NZDUSD: Trend with Support and Resistance Levels
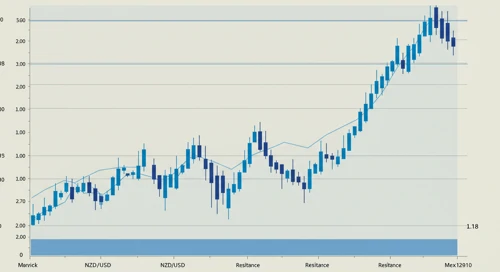
NZDUSD: Current price trend is evaluated alongside key support and resistance level. View of potential turning points and price momentum.
May 30, 2026 a 04:28 am
RCL: Trend with Support and Resistance Levels - Royal Caribbean Cruises Ltd
RCL: Current price trend is evaluated alongside key support and resistance level. View of potential turning points and price momentum.
May 30, 2026 a 04:03 am
RTX: Trend with Support and Resistance Levels - RTX Corporation
RTX: Current price trend is evaluated alongside key support and resistance level. View of potential turning points and price momentum.
May 30, 2026 a 03:15 am
KIM: Dividend Analysis - Kimco Realty Corporation
KIM: In-depth analysis of a company's dividend stability and key fundamental ratios to assess its financial strength and long-term investment potential.
May 30, 2026 a 02:46 am
Stock Market - Heatmap
Use mouse wheel to zoom in and out. Click a ticker to display detailed information in a new window. Hover mouse cursor over a ticker to see more data.
Stock's
LYV: Analysts Ratings - Live Nation Entertainment Inc

LYV: Comprehensive breakdown of current and historical analyst ratings, offering insights into how expert sentiment has evolved over time.
May 29, 2026 a 05:00 pm
EG: Fibunacci Level Technical Analysis - Everest Re Group Ltd
EG: Fibonacci retracement levels to identify key potential support and resistance zones, based on recent price trends.
May 29, 2026 a 04:44 pm
AZO: Analysts Ratings - AutoZone Inc
AZO: Comprehensive breakdown of current and historical analyst ratings, offering insights into how expert sentiment has evolved over time.
May 29, 2026 a 04:38 pm
BXP: Fundamental Ratio Analysis - BXP Inc
BXP: Evaluation of key financial ratios, analyst ratings, and price targets. A data-driven perspective on the valuation and market expectations.
May 29, 2026 a 03:43 pm
FAST: Dividend Analysis - Fastenal Company
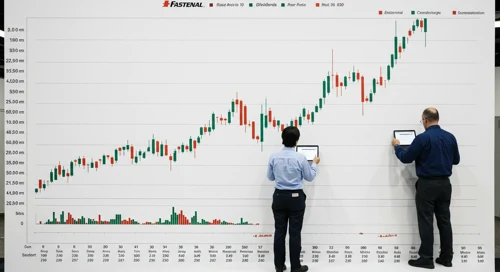
FAST: In-depth analysis of a company's dividend stability and key fundamental ratios to assess its financial strength and long-term investment potential.
May 29, 2026 a 03:31 pm
VZ: Fibunacci Level Technical Analysis - Verizon Communications Inc
VZ: Fibonacci retracement levels to identify key potential support and resistance zones, based on recent price trends.
May 29, 2026 a 03:15 pm
EVRG: Trend with Support and Resistance Levels - Evergy Inc

EVRG: Current price trend is evaluated alongside key support and resistance level. View of potential turning points and price momentum.
May 29, 2026 a 02:03 pm

BBY: Analysts Ratings - Best Buy Co Inc
May 29, 2026 a 09:00 pm

NEM: Analysts Ratings - Newmont Corporation
May 29, 2026 a 08:38 pm
INVH: Fundamental Ratio Analysis - Invitation Homes Inc
May 29, 2026 a 07:43 pm
EXR: Fundamental Ratio Analysis - Extra Space Storage Inc
May 29, 2026 a 06:00 pm
MU: Trend with Support and Resistance Levels - Micron Technology Inc
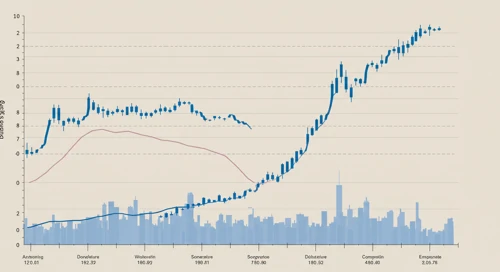
MU: Current price trend is evaluated alongside key support and resistance level. View of potential turning points and price momentum.
May 29, 2026 a 01:15 pm
PYPL: Analysts Ratings - PayPal Holdings Inc

PYPL: Comprehensive breakdown of current and historical analyst ratings, offering insights into how expert sentiment has evolved over time.
May 29, 2026 a 01:00 pm
COIN: Fundamental Ratio Analysis - Coinbase Global Inc

COIN: Evaluation of key financial ratios, analyst ratings, and price targets. A data-driven perspective on the valuation and market expectations.
May 29, 2026 a 01:00 pm
EQIX: Dividend Analysis - Equinix Inc

EQIX: In-depth analysis of a company's dividend stability and key fundamental ratios to assess its financial strength and long-term investment potential.
May 29, 2026 a 12:46 pm
NTAP: Analysts Ratings - NetApp Inc
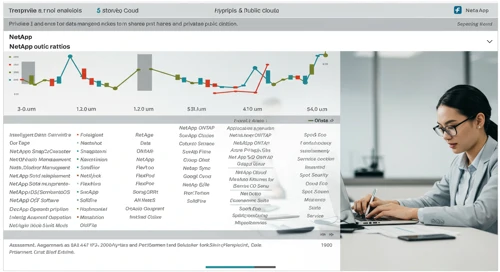
NTAP: Comprehensive breakdown of current and historical analyst ratings, offering insights into how expert sentiment has evolved over time.
May 29, 2026 a 12:38 pm
APP: Fibunacci Level Technical Analysis - AppLovin Corporation
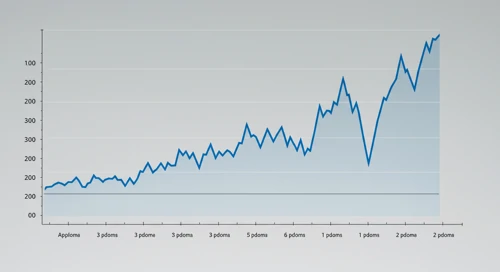
APP: Fibonacci retracement levels to identify key potential support and resistance zones, based on recent price trends.
May 29, 2026 a 11:44 am
CAT: Fundamental Ratio Analysis - Caterpillar Inc
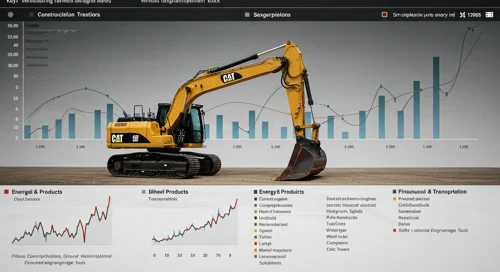
CAT: Evaluation of key financial ratios, analyst ratings, and price targets. A data-driven perspective on the valuation and market expectations.
May 29, 2026 a 11:43 am
Economic Calendar
Currencies
AUDUSD: Fibunacci Level Technical Analysis
AUDUSD: Fibonacci retracement levels to identify key potential support and resistance zones, based on recent price trends.
May 28, 2026 a 05:08 am
USDCHF: Trend with Support and Resistance Levels
USDCHF: Current price trend is evaluated alongside key support and resistance level. View of potential turning points and price momentum.
May 28, 2026 a 04:28 am
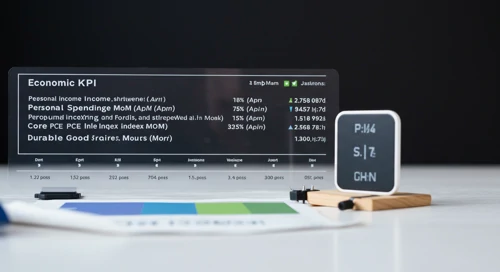
Important Key Figures of the last Days
Overview of key economic indicators released over the past days, highlighting their potential impact on markets and investor sentiment.
May 28, 2026 a 02:31 am
Todays Important Key Figures 27 May

Today’s important economic data releases – a snapshot of key indicators influencing markets and shaping financial expectations.
May 27, 2026 a 07:00 pm
GBPAUD: Fibunacci Level Technical Analysis
GBPAUD: Fibonacci retracement levels to identify key potential support and resistance zones, based on recent price trends.
May 27, 2026 a 05:08 am
EURJPY: Trend with Support and Resistance Levels
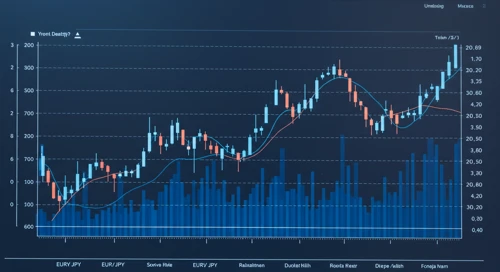
EURJPY: Current price trend is evaluated alongside key support and resistance level. View of potential turning points and price momentum.
May 27, 2026 a 04:28 am
Todays Important Key Figures 26 May

Today’s important economic data releases – a snapshot of key indicators influencing markets and shaping financial expectations.
May 26, 2026 a 07:00 pm

Todays Important Key Figures 30 May
May 29, 2026 a 11:00 pm

Todays Important Key Figures 29 May
May 29, 2026 a 07:00 pm
GBPNZD: Fibunacci Level Technical Analysis
May 29, 2026 a 05:08 am
Todays Important Key Figures 28 May
May 28, 2026 a 07:00 pm
CADJPY: Fibunacci Level Technical Analysis
CADJPY: Fibonacci retracement levels to identify key potential support and resistance zones, based on recent price trends.
May 26, 2026 a 05:08 am
EURGBP: Trend with Support and Resistance Levels
EURGBP: Current price trend is evaluated alongside key support and resistance level. View of potential turning points and price momentum.
May 26, 2026 a 04:28 am
Important Key Figures of the last Days

Overview of key economic indicators released over the past days, highlighting their potential impact on markets and investor sentiment.
May 26, 2026 a 02:31 am
Todays Important Key Figures 25 May

Today’s important economic data releases – a snapshot of key indicators influencing markets and shaping financial expectations.
May 25, 2026 a 07:00 pm
GBPUSD: Fibunacci Level Technical Analysis
GBPUSD: Fibonacci retracement levels to identify key potential support and resistance zones, based on recent price trends.
May 25, 2026 a 05:08 am
GBPJPY: Trend with Support and Resistance Levels
GBPJPY: Current price trend is evaluated alongside key support and resistance level. View of potential turning points and price momentum.
May 25, 2026 a 04:28 am
GBPCAD: Fibunacci Level Technical Analysis
GBPCAD: Fibonacci retracement levels to identify key potential support and resistance zones, based on recent price trends.
May 24, 2026 a 05:08 am
Currencies