August 22, 2025 a 04:03 am
DECK: Trend and Support & Resistance Analysis - Deckers Outdoor Corporation
Deckers Outdoor Corporation has shown significant volatility over the past months, indicative of various market factors affecting the price. The company, well-regarded for its premium footwear and apparel, operates in a competitive landscape. Current trends suggest potential for savvy investors, yet caution is advised given recent fluctuations. Monitoring key support and resistance levels can provide insights into optimal entry and exit points.
Trend Analysis
| Date | Close Price | Trend |
|---|---|---|
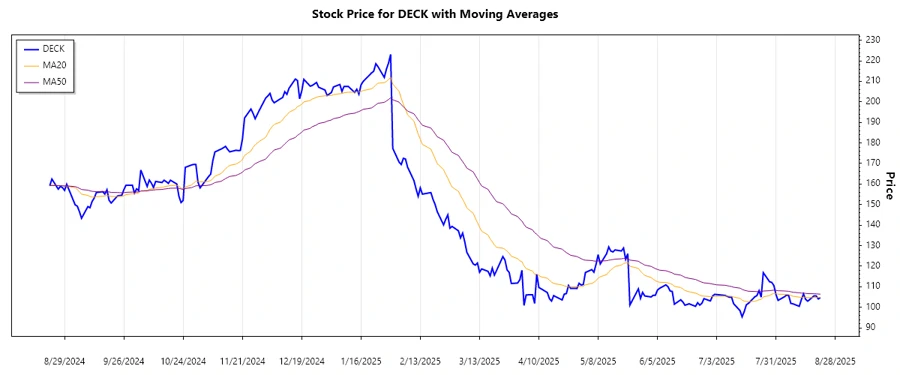
| 2025-08-21 | 104.69 | ▼ Abwärtstrend |
| 2025-08-20 | 104.05 | ▼ Abwärtstrend |
| 2025-08-19 | 105.52 | ▼ Abwärtstrend |
| 2025-08-18 | 105.58 | ⚖️ Seitwärtstrend |
| 2025-08-15 | 102.96 | ▼ Abwärtstrend |
| 2025-08-14 | 103.86 | ▼ Abwärtstrend |
| 2025-08-13 | 106.48 | ▲ Aufwärtstrend |
The EMA analysis shows a persistent downtrend with recent pressures driving the stock price lower. This suggests a bearish sentiment among investors. However, potential reversals could be in sight if market conditions change.
Support- and Resistance
| Zone Type | From | To |
|---|---|---|
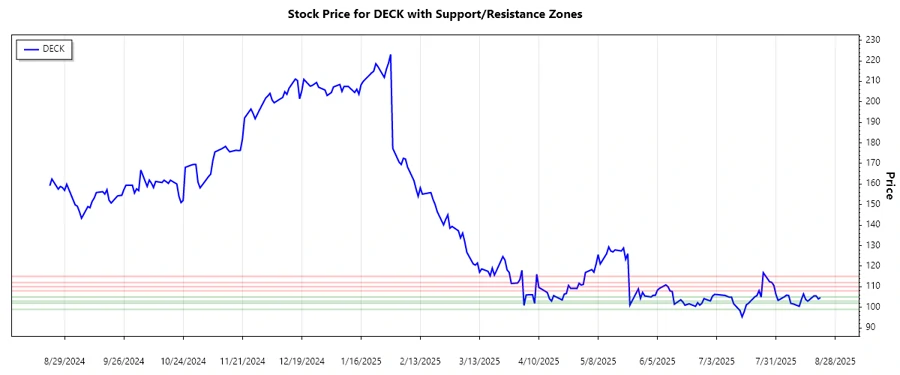
| Support Zone 1 | 103 | 105 |
| Support Zone 2 | 99 | 102 |
| Resistance Zone 1 | 108 | 110 |
| Resistance Zone 2 | 112 | 115 |
The DECK stock is currently near its first support zone, suggesting a critical level to watch for potential rebounds. The current price level indicates a testing of support, which, if breached, may lead to downward acceleration.
Conclusion
The recent trend for Deckers Outdoor Corporation suggests a cautious outlook with the potential for both opportunities and risks. The bearish trend may present buying opportunities if the stock rebounds from established support zones. Conversely, breaking below support levels could further depress prices. The company’s diverse brand portfolio and international presence provide growth potential but are subject to market volatility. Analysts should closely monitor macroeconomic indicators and competitive actions affecting DECK's performance.
Smart Data Insight
Master the Perfect Entry & Exit for this Stock
Don't leave your profits to chance. Historically, this stock follows specific seasonal patterns that institutional traders use to maximize returns.
- ✅ Identify the "Golden Buying Window"
- ✅ Avoid high-risk correction cycles
- ✅ Backtested data from the last 20+ years