June 06, 2025 a 04:03 am

DECK: Trend and Support & Resistance Analysis - Deckers Outdoor Corporation
Deckers Outdoor Corporation has shown significant price movements over the past months with noticeable trends. The stock has experienced fluctuations due to various market influences. Investors should pay close attention to the recent price corrections and potential for future growth based on brand performance and market expansion. Current trends in the technicals could guide future investment strategies.
Trend Analysis
| Date | Closing Price | Trend |
|---|---|---|
| 2025-06-05 | 108.32 | ▼ |
| 2025-06-04 | 105.81 | ▼ |
| 2025-06-03 | 105.83 | ⚖️ |
| 2025-06-02 | 105.01 | ▼ |
| 2025-05-30 | 105.52 | ⚖️ |
| 2025-05-29 | 107.27 | ▲ |
| 2025-05-28 | 104.32 | ▼ |
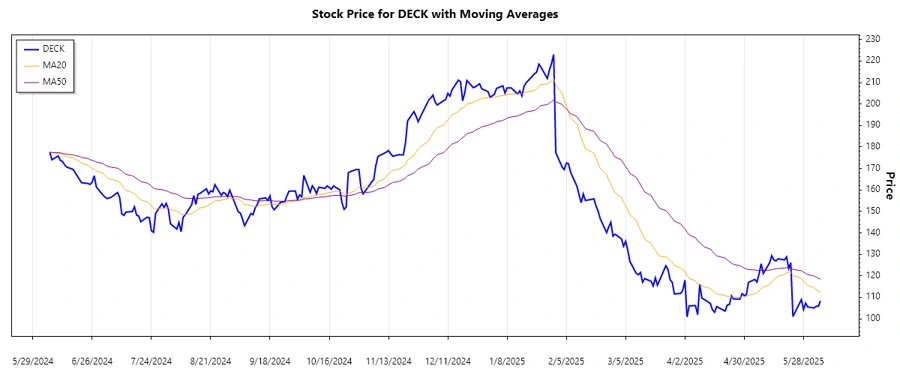
The calculation of the EMA indicates the current market is in a ▼ Downtrend as EMA20 is less than EMA50, suggesting a bearish market outlook.
Support and Resistance
| Zone Type | Zone Start | Zone End |
|---|---|---|
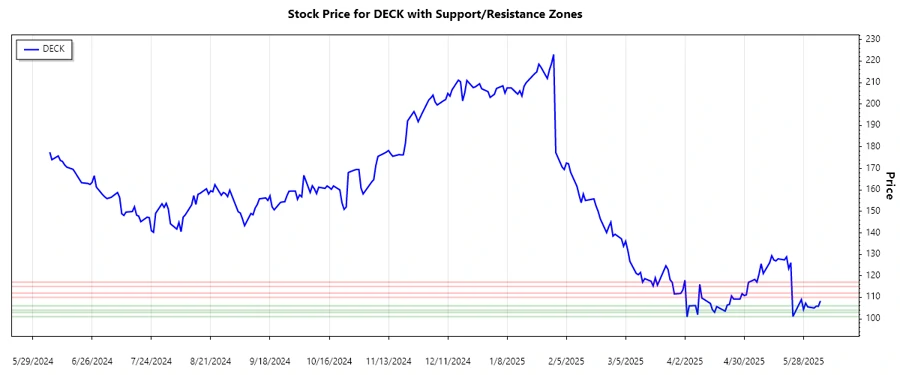
| Support 1 | 104.00 | 106.00 |
| Support 2 | 101.00 | 103.00 |
| Resistance 1 | 110.00 | 112.00 |
| Resistance 2 | 115.00 | 117.00 |
The current closing price is found below the nearest support zone, indicating potential further decline unless there's a reversal.
Conclusion
The DECK stock is currently showing a ▼ Downtrend, reflecting possible bearish sentiments with support being tested. The near support level could provide a halt to the price fall if buying pressure increases. However, investors should be cautious of the potential break below support, indicating further price weakness. The identified resistance levels will offer challenges should the price attempt to recover. Continued attention to technical indicators and market sentiments will be crucial in guiding investment decisions.
Smart Data Insight
Master the Perfect Entry & Exit for this Stock
Don't leave your profits to chance. Historically, this stock follows specific seasonal patterns that institutional traders use to maximize returns.
- ✅ Identify the "Golden Buying Window"
- ✅ Avoid high-risk correction cycles
- ✅ Backtested data from the last 20+ years