
June 29, 2026 a 04:45 pm
DECK: Fibonacci Analysis - Deckers Outdoor Corporation
Deckers Outdoor Corporation has demonstrated significant volatility in recent months, with both upward and downward movements. The analysis of historical data reveals a significant downward trend, which provides an opportunity to apply Fibonacci retracement. Investors should carefully monitor the stock for potential support and resistance levels that the retracement may indicate. Additionally, Deckers' diverse brand portfolio and global market presence can impact future price fluctuations.
Fibonacci Analysis
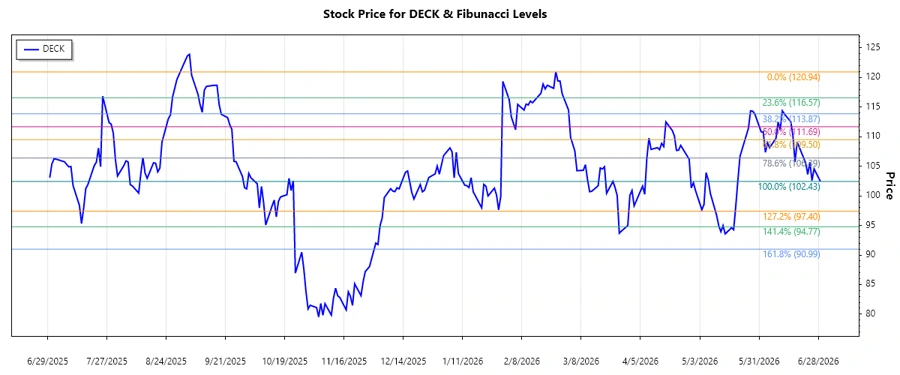
The latest data analysis demonstrates a dominant downward trend in Deckers Outdoor Corporation's stock, spanning from February 2026 to June 2026. During this period, the stock reached a high of $120.94 on 2026-02-24 and a low of $102.43 on 2026-06-29. The retracement levels calculated from this range present potential support and resistance levels.
| Level | Price |
|---|---|
| 0.236 | 116.6013 |
| 0.382 | 112.1613 |
| 0.5 | 108.685 |
| 0.618 | 105.2087 |
| 0.786 | 100.2821 |
As of the latest available data, the current price of $102.43 is just above the 0.786 retracement level, indicating that it is in the lower retracement zone. This level may act as a support, but further observation is necessary.
Technically, the presence of the price near the 0.786 retracement level could indicate potential support, suggesting buyers may enter the market at these levels. However, if prices fall below, it may signal further downside risk.
Conclusion
Deckers Outdoor Corporation has showcased a pronounced downward trend with its price nearing potential support levels. Analysts should weigh the stock's movements against its historical performance and consider market conditions influencing the apparel and footwear industry. While the current supports may offer buying opportunities, the risk of further declines necessitates caution. Deckers' global presence and brand strength can serve as buffers against volatility, yet market dynamics remain unpredictable. Overall, it remains crucial for investors to keep an eye on price actions and macroeconomic factors impacting the industry.
Smart Data Insight
Master the Perfect Entry & Exit for this Stock
Don't leave your profits to chance. Historically, this stock follows specific seasonal patterns that institutional traders use to maximize returns.
- ✅ Identify the "Golden Buying Window"
- ✅ Avoid high-risk correction cycles
- ✅ Backtested data from the last 20+ years