May 19, 2026 a 11:44 am
DECK: Fibunacci Analysis - Deckers Outdoor Corporation
Deckers Outdoor Corporation has exhibited a significant trend over the recent months, with its diverse product portfolio catering to both lifestyle and high-performance segments. The company has managed to capture substantial market attention through its direct-to-consumer platforms and extensive retail distributions, showcasing a blend of traditional and innovative business strategies. As a result, their stock performance remains a subject of interest; let's delve into the recent trend analysis and see what the technical indicators have to say.
Fibonacci Analysis
| Detail | Information |
|---|---|
| Start Date | 2025-09-05 |
| End Date | 2026-05-18 |
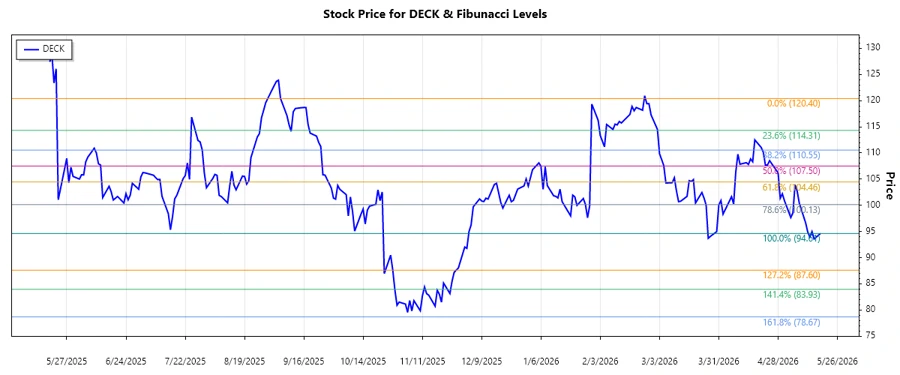
| High Point (Date & Price) | 2025-09-05, $120.4 |
| Low Point (Date & Price) | 2026-05-18, $94.61 |
| Fibonacci Level 0.236 | $101.65 |
| Fibonacci Level 0.382 | $104.91 |
| Fibonacci Level 0.5 | $107.505 |
| Fibonacci Level 0.618 | $110.1 |
| Fibonacci Level 0.786 | $113.48 |
| Current Price Retracement Zone | None |
| Technical Interpretation | The current price is below the 0.236 Fibonacci retracement, yet not significantly within a defined retracement zone, indicating possible resistance at higher levels. |
Conclusion
After a pronounced downtrend over recent months, Deckers Outdoor Corporation's stock is trading below the appropriate retracement levels. This suggests potential resistance in the near term as the stock may continue to face downward pressure unless significant supportive factors emerge. For analysts, this provides an opportunity to observe how the stock reacts to key levels in subsequent trading sessions. Note the potential for volatility which presents both opportunity and risk depending on broader market conditions.
Smart Data Insight
Master the Perfect Entry & Exit for this Stock
Don't leave your profits to chance. Historically, this stock follows specific seasonal patterns that institutional traders use to maximize returns.
- ✅ Identify the "Golden Buying Window"
- ✅ Avoid high-risk correction cycles
- ✅ Backtested data from the last 20+ years