March 01, 2026 a 05:15 am

DECK: Fibonacci Analysis - Deckers Outdoor Corporation
The Deckers Outdoor Corporation stock exhibits a dynamic history, with distinct price movements influenced by market conditions and company-specific factors. Recently, the stock has shown a notable trend reversal, marking an entry point for potential investment strategies. Understanding the technical aspects can provide investors with insights into key support and resistance levels through Fibonacci analysis. This aids in identifying potential price zones where the stock might retrace before continuing its previous trend.
Fibonacci Analysis
| Start Date | End Date | High Price | Low Price |
|---|---|---|---|
| 2025-11-05 | 2026-02-27 | 137.24 (2025-03-03) | 79.54 (2025-11-04) |
Fibonacci Levels
| Level | Price |
|---|---|
| 0.236 | 93.15 |
| 0.382 | 102.13 |
| 0.5 | 108.39 |
| 0.618 | 114.65 |
| 0.786 | 123.94 |
Currently, the stock price is within the 0.382 Fibonacci retracement level, suggesting a potential consolidation before any continued upward movement. Technically, this level could serve as a support, indicating a buying opportunity if the upward trend resumes.
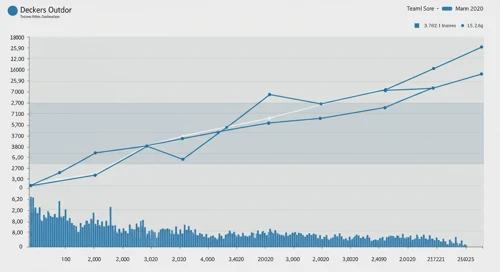
Deckers Outdoor Corporation Stock Chart
Conclusion
The recent analysis of Deckers Outdoor Corporation indicates a prominent upward trend beginning in late 2025, with a corrective phase exhibiting potential buying zones. The presence of the stock within the 0.382 Fibonacci level underscores this as a technical support area, presenting opportunities alongside inherent market risks. Investors should balance the positive momentum against broader economic factors and company performance to gauge entry and exit strategies effectively. Overall, this Fibonacci analysis provides a structured framework for anticipating future price movements and making informed investment decisions.