September 24, 2025 a 11:45 am
DECK: Fibonacci Analysis - Deckers Outdoor Corporation
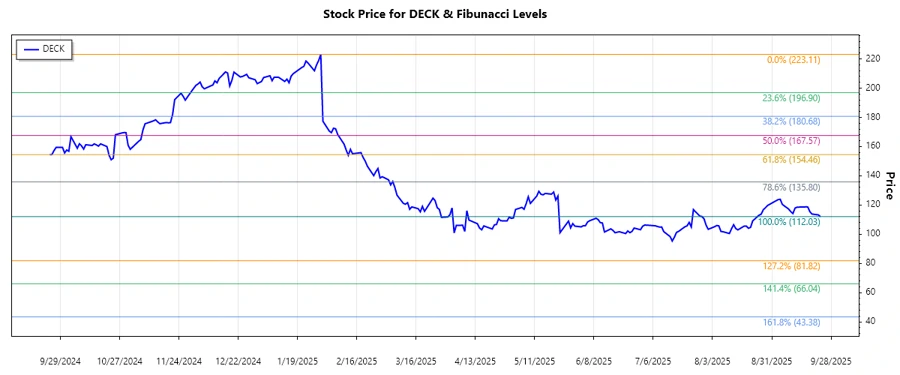
Deckers Outdoor Corporation has experienced a significant decline in its stock price over recent months. The company, known for its premium footwear and apparel, is navigating a challenging market with heightened competition and changing consumer demands. This downtrend suggests that investors should remain cautious, although the company's strong brand portfolio still provides some long-term potential.
Fibonacci Analysis
| Parameter | Value |
|---|---|
| Trend Type | Down |
| Start Date | 2025-01-30 |
| End Date | 2025-09-23 |
| High Point (Price/Date) | $223.11 / 2025-01-30 |
| Low Point (Price/Date) | $112.03 / 2025-09-23 |
| Fibonacci Level | Price Level |
|---|---|
| 0.236 | $140.86 |
| 0.382 | $157.56 |
| 0.5 | $167.57 |
| 0.618 | $177.58 |
| 0.786 | $191.79 |
The current stock price is not in a Fibonacci retracement zone, indicating that it is trading well below these potential support levels. This suggests further downside risk without a reversal pattern confirmation.
The stock is testing the previous lows, and technical indicators do not show a sign of reversal; this could mean that the current support might become resistance in the future.
Conclusion
The decline in Deckers Outdoor Corporation's stock suggests an ongoing downtrend, influenced by challenging market conditions and heightened competition. While the company's strong brand presence provides strategic advantages, investors should remain cautious unless key Fibonacci support levels show signs of holding firm. The potential for further downside exists if current support levels become resistance. Nevertheless, any sustainable recovery in consumer demand or new product innovation may serve as catalysts for future upward movement, requiring close monitoring of market dynamics and financial indicators.