May 21, 2026 a 01:15 pm
DDOG: Trend and Support & Resistance Analysis - Datadog, Inc.
Datadog, Inc. has exhibited a series of fluctuations over the past months influenced by market dynamics and technological innovation within its sector. The company's stock performance reflects its robust position in the real-time cloud monitoring sector. However, recent volatility in the tech market may pose challenges. Monitoring the broader market sentiment and technological advancements will be key to future performance analysis.
Trend Analysis
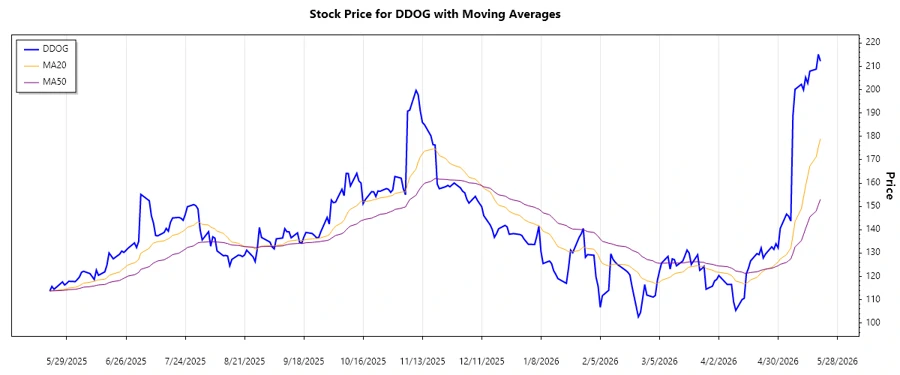
Based on the calculations of EMA20 and EMA50, the trend over the last few months generally indicates an upward momentum, showcasing market confidence in Datadog's offerings. By analyzing the closing prices, the following trend table has been formulated:
| Date | Close Price | Trend |
|---|---|---|
| 2026-05-20 | 212.24 | ▲ Uptrend |
| 2026-05-19 | 215.15 | ▲ Uptrend |
| 2026-05-18 | 208.82 | ▲ Uptrend |
| 2026-05-15 | 207.98 | ▲ Uptrend |
| 2026-05-14 | 202.84 | ▲ Uptrend |
| 2026-05-13 | 205.31 | ▲ Uptrend |
| 2026-05-12 | 199.94 | ▲ Uptrend |
The trend analysis shows a dominant upward trend, with the EMA20 surpassing the EMA50 consistently, indicating bullish momentum. This suggests heightened investor confidence and potential future gains if this pattern holds.
Support- and Resistance
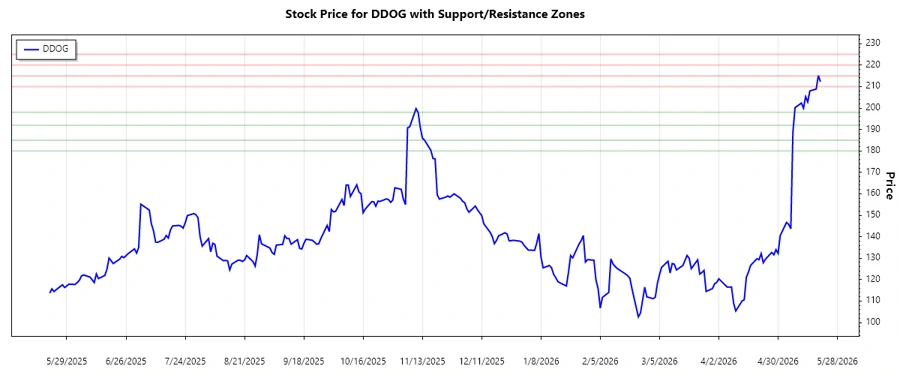
Given the recent price movements, the following support and resistance zones have been identified:
| Zone Type | Price From | Price To |
|---|---|---|
| Support | 192.00 | 198.00 |
| Support | 180.00 | 185.00 |
| Resistance | 210.00 | 215.00 |
| Resistance | 220.00 | 225.00 |
The current price sits within the upper resistance zone of 210.00 to 215.00, suggesting potential near-term price struggles to break through if market conditions don't change. Long-term signals advise caution but remain optimistic.
Conclusion
Datadog Inc. stands positioned within a dynamic upward trend, reflecting robust business performance and favorable market conditions. The current technical indicators suggest moderate caution as resistance areas are tested. Investors should remain vigilant, factoring potential tech market fluctuations and technological advancements in real-time monitoring services. The financial prognosis remains positive, with strategic market positioning and investor confidence being key drivers of future valuation.
Smart Data Insight
Master the Perfect Entry & Exit for this Stock
Don't leave your profits to chance. Historically, this stock follows specific seasonal patterns that institutional traders use to maximize returns.
- ✅ Identify the "Golden Buying Window"
- ✅ Avoid high-risk correction cycles
- ✅ Backtested data from the last 20+ years