September 05, 2025 a 08:15 am
DDOG: Trend and Support & Resistance Analysis - Datadog, Inc.
Datadog, Inc., a leader in the SaaS industry, provides an extensive platform for monitoring cloud applications. Over the past few months, the stock has shown fluctuating trends with recent stabilizations. Investors are closely watching its support and resistance levels to assess future price movements.
Trend Analysis
| Date | Closing Price | Trend |
|---|---|---|
| Sept 4, 2025 | $131.78 | ▼ |
| Sept 3, 2025 | $132.60 | ▼ |
| Sept 2, 2025 | $134.69 | ▲ |
| Aug 29, 2025 | $136.68 | ▲ |
| Aug 28, 2025 | $140.96 | ▲ |
| Aug 27, 2025 | $131.73 | ▼ |
| Aug 26, 2025 | $126.31 | ▼ |
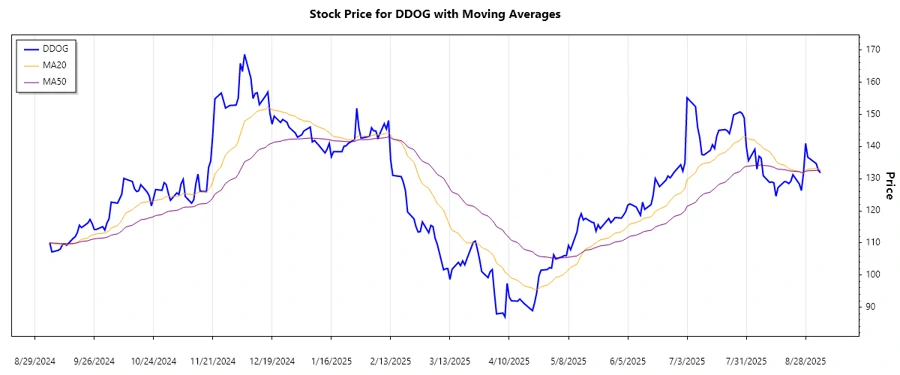
After calculating the EMA20 and EMA50, it is observed that EMA20 ≈ EMA50 over the analyzed period, indicating a ⚖️ sideways trend. Investors should consider monitoring the situation for any potential breakout.
Support- and Resistance
| Zone Type | From | To | |
|---|---|---|---|
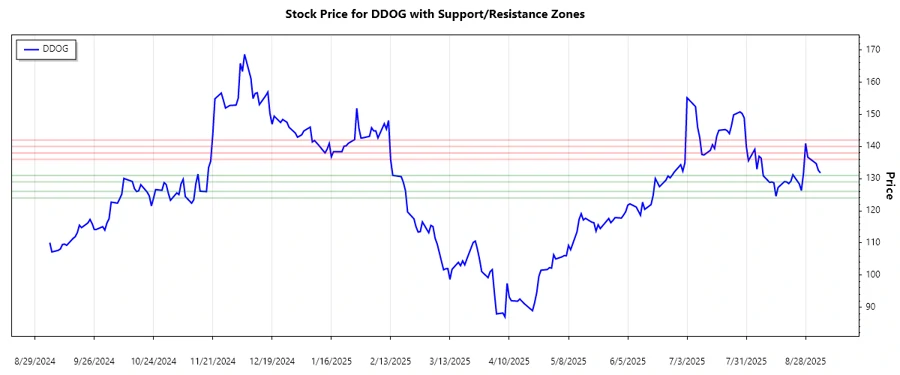
| Support | $124.00 | $126.00 | ▼ |
| Support | $129.00 | $131.00 | ▼ |
| Resistance | $136.00 | $138.00 | ▲ |
| Resistance | $140.00 | $142.00 | ▲ |
The current price is near the immediate support zone between $129 and $131. A break below may indicate bearish momentum, while a bounce could suggest bullish potential.
Conclusion
Datadog's stock remains a compelling observation point for investors given its well-established SaaS platform and the dynamic industry it operates within. The current sideways trend highlights an impending breakout, demanding attention to both fundamental strengths and incurred risks. The support-resistance analysis hints at potential opportunities for both short and long positions, depending on forthcoming market dynamics. Analysts are advised to re-evaluate positions as the stock approaches its critical zones.
Smart Data Insight
Master the Perfect Entry & Exit for this Stock
Don't leave your profits to chance. Historically, this stock follows specific seasonal patterns that institutional traders use to maximize returns.
- ✅ Identify the "Golden Buying Window"
- ✅ Avoid high-risk correction cycles
- ✅ Backtested data from the last 20+ years