April 30, 2026 a 03:15 pm

DDOG: Fibonacci Analysis - Datadog, Inc.
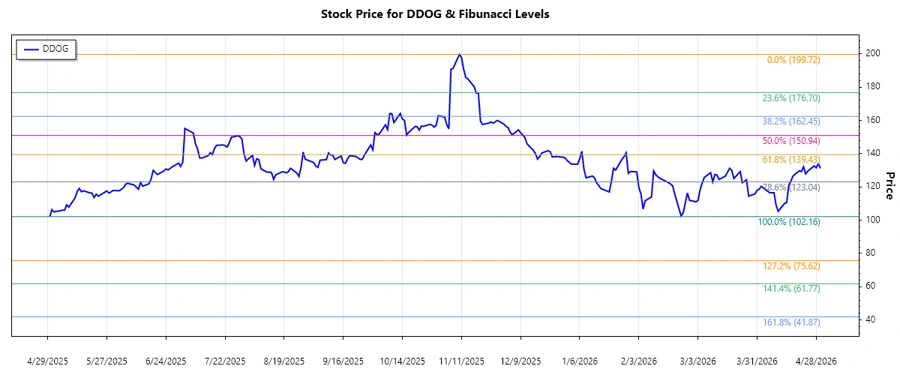
Datadog, Inc. has been on a downward trend over the past months, indicative of challenges within its business model or broader market conditions. Despite industry tailwinds such as the increase in cloud adoption, Datadog faces competition, and any strategic missteps could impact investor confidence. The stock's recent performance suggests the need for careful analysis and potentially signals future volatility.
Fibonacci Analysis
| Detail | Data |
|---|---|
| Trend Start Date | 2025-11-10 |
| Trend End Date | 2026-04-30 |
| High Price and Date | $199.72 on 2025-11-10 |
| Low Price and Date | $102.16 on 2025-04-30 |
| Current Price | $131.2 |
Calculated Fibonacci Levels:
| Retracement Level | Price Level |
|---|---|
| 0.236 | $143.58 |
| 0.382 | $154.47 |
| 0.5 | $160.94 |
| 0.618 | $167.41 |
| 0.786 | $177.7 |
The current price is $131.2, which does not fall within the Fibonacci retracement zones.
The technical analysis implies the stock is currently below all significant Fibonacci levels, indicating resistance ahead and potential difficulties in breaking above these prices without substantial buying pressure.
Conclusion
Datadog, Inc.'s current positioning below the important Fibonacci retracement levels suggests prevailing downward sentiment among traders and possible resistance levels ahead. The stock has potential for recovery, but it may face significant obstacles unless supported by positive earnings reports or improved industry conditions. Investors should be wary of further declines and monitor closely for signs of trend reversal or continued downward momentum. Analyst caution is advised, particularly given the competitive dynamics in the SaaS and cloud monitoring sector.