October 03, 2025 a 04:45 pm
DDOG: Fibonacci Analysis - Datadog, Inc.
Datadog, Inc., a leader in cloud monitoring solutions, has shown significant market movements over the past months. With a comprehensive platform for monitoring and analytics, it continues to appeal to various tech sectors. Recent data suggests a predominant upward trend, offering potential investment opportunities amidst market volatility. Analyzing the stock through technical indicators such as Fibonacci levels provides key insights into potential future price movements.
Fibonacci Analysis
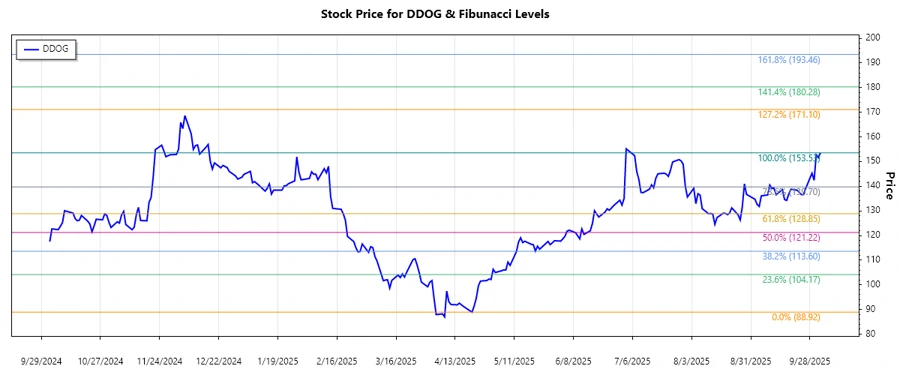
Based on the data, the last identified trend shows an upward movement. Analyzed from early 2025 to October 2025, this trend marks significant price levels critical for technical analysis.
| Metric | Details |
|---|---|
| Start Date | 2025-04-21 |
| End Date | 2025-10-03 |
| High Point (Date & Price) | 2025-10-03 & $153.53 |
| Low Point (Date & Price) | 2025-04-21 & $88.92 |
Fibonacci Retracement Levels
| Level | Price Level |
|---|---|
| 0.236 | $107.02 |
| 0.382 | $116.30 |
| 0.5 | $121.22 |
| 0.618 | $126.14 |
| 0.786 | $132.59 |
The current price, as per the latest data, suggests the stock is not within a retracement zone. This indicates the continuation of the upward trend or consolidation outside of these levels.
This situation technically implies potential support levels developing around the 0.5 Fibonacci mark should a pullback occur, offering possible entry points for traders.
Conclusion
Datadog, Inc. has shown promising growth, marching upwards driven by its solid cloud-based offerings. The analysis suggests a strong upward trend that hasn't entered significant retracement zones yet, indicating potential continuity. However, investors should remain cautious of market volatility, which might introduce pullbacks to key Fibonacci levels acting as support or resistance. The stock presents potential opportunities for technical traders looking for strategic entries based on Fibonacci analysis.
Smart Data Insight
Master the Perfect Entry & Exit for this Stock
Don't leave your profits to chance. Historically, this stock follows specific seasonal patterns that institutional traders use to maximize returns.
- ✅ Identify the "Golden Buying Window"
- ✅ Avoid high-risk correction cycles
- ✅ Backtested data from the last 20+ years