August 23, 2025 a 03:15 pm
DDOG: Fibonacci Analysis - Datadog, Inc.
Datadog, Inc. has been a strong performer in the cloud monitoring and analytics space, leveraging its comprehensive SaaS platform to offer real-time insights to developers and IT teams. Despite market fluctuations, the stock has shown resilience, recovering from periodic downturns with a steady uptrend. This analysis focuses on the technical aspects, highlighting significant levels where traders may anticipate potential reversals or continuations in price action.
Fibonacci Analysis
| Trend Details | Dates and Prices |
|---|---|
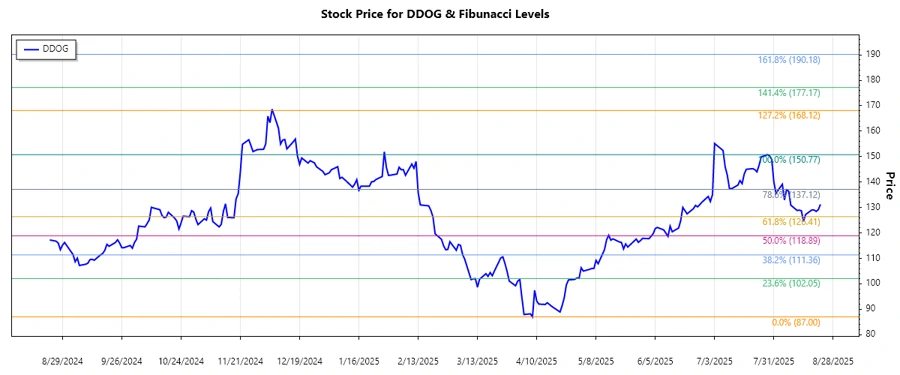
| Trend Start Date | 2024-11-12 |
| Trend End Date | 2025-07-28 |
| High Point | 150.77 on 2025-07-28 |
| Low Point | 87.00 on 2025-04-08 |
| Fibonacci Level | Price Level |
|---|---|
| 0.236 | 103.98 |
| 0.382 | 112.83 |
| 0.5 | 118.88 |
| 0.618 | 124.92 |
| 0.786 | 132.88 |
Currently, the price is at 131.22, which places it within the 0.786 Fibonacci retracement level. This suggests a potential resistance area where traders might see a reversal or continued consolidation before a further breakout.
Conclusion
The recent data for Datadog, Inc. reveals an ascending trend from its previous low on April 8, 2025. The stock has reached significant retracement levels, indicating a consolidation phase. With the current price near a major Fibonacci level, market participants should watch for further indications of upward momentum or potential reversal. Despite the robust progress, some caution is warranted as the price approaches resistance zones. Analysts might consider the broader market environment and upcoming earnings reports as they could impact future price movements.
Smart Data Insight
Master the Perfect Entry & Exit for this Stock
Don't leave your profits to chance. Historically, this stock follows specific seasonal patterns that institutional traders use to maximize returns.
- ✅ Identify the "Golden Buying Window"
- ✅ Avoid high-risk correction cycles
- ✅ Backtested data from the last 20+ years