January 09, 2026 a 03:15 pm
DAY: Fibonacci Analysis - Dayforce Inc
Dayforce Inc, previously known as Ceridian HCM Holding Inc, has been showing significant market movements, gaining attention among investors. With robust offerings in human capital management software, it maintains a strong position in the industry. The company has demonstrated resilience in its stock performance over past months, showing both stability and growth potential.
Fibonacci Analysis
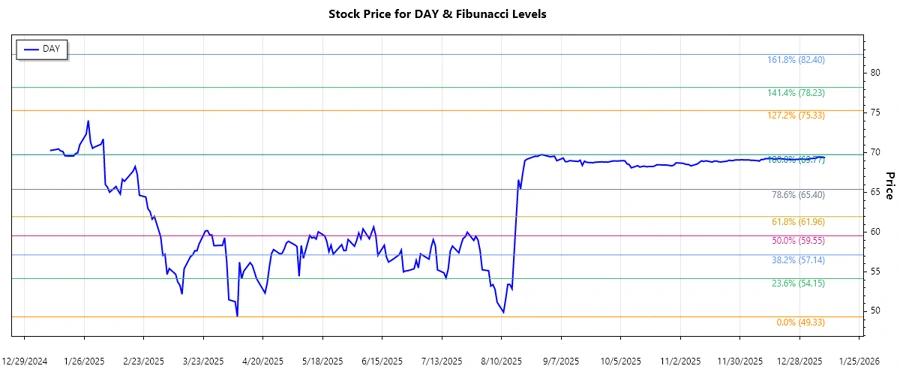
Based on our analysis, Dayforce Inc. has experienced a dominant upward trend in recent months, characterized by a notable higher high point. Using the Fibonacci retracement tool, we analyzed levels from the trend's highest point at $69.77 on 2025-08-29 to its lowest point at $49.33 on 2025-04-08. Here are our detailed findings:
| Aspect | Details |
|---|---|
| Start Date | 2025-04-08 |
| End Date | 2025-08-29 |
| High Point | $69.77 at 2025-08-29 |
| Low Point | $49.33 at 2025-04-08 |
Fibonacci Retracement Levels:
| Level | Price |
|---|---|
| 0.236 | $54.57 |
| 0.382 | $57.55 |
| 0.5 | $59.55 |
| 0.618 | $61.55 |
| 0.786 | $64.28 |
As of the last data point, the current price is $69.41. This indicates that the stock price is well above the 0.786 retracement level, suggesting that it has broken past typical retracement areas, which can be interpreted as strong bullish momentum. Investors might consider this behavior as an indicator of continued strength, potentially identifying the recent high levels as new support.
Conclusion
Dayforce Inc's stock has shown formidable upward momentum, surpassing several retracement levels and indicating continued optimism among investors. While the elevated trading price suggests potential profitability, it is crucial to monitor for any signs of overextension in the coming months. The challenges include ensuring that the company's growth is sustainable whereas opportunities lie in its strong market position in the human capital management domain. Analysts should keep these factors in mind to gauge future price trajectories.
Smart Data Insight
Master the Perfect Entry & Exit for this Stock
Don't leave your profits to chance. Historically, this stock follows specific seasonal patterns that institutional traders use to maximize returns.
- ✅ Identify the "Golden Buying Window"
- ✅ Avoid high-risk correction cycles
- ✅ Backtested data from the last 20+ years