
June 25, 2026 a 06:44 am

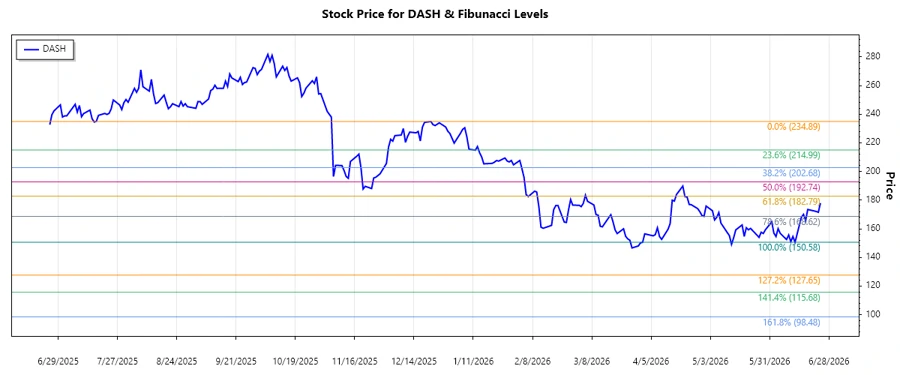
DASH: Fibonacci Analysis - DoorDash, Inc.
DoorDash, Inc. (Ticker: DASH) has shown significant fluctuations over the observed period with noticeable volatility. Despite recent downward pressure, the company's robust logistics platform and subscription-based models like DashPass provide a stable source of revenue, supporting a potential recovery. The recent price action indicates the emergence of a bearish trend, potentially providing short-term trading opportunities.
Fibonacci Analysis
| Detail | Value |
|---|---|
| Trend Start Date | 2025-12-08 |
| Trend End Date | 2026-06-24 |
| High Price | $234.89 (2025-12-22) |
| Low Price | $150.58 (2026-06-12) |
| Fibonacci 0.236 Level | $172.69 |
| Fibonacci 0.382 Level | $183.46 |
| Fibonacci 0.5 Level | $192.73 |
| Fibonacci 0.618 Level | $202.00 |
| Fibonacci 0.786 Level | $216.60 |
| Current Price | $177.93 |
| Retracement Zone | 0.236 |
The current price is within the Fibonacci 0.236 retracement zone, indicating a potential support level. If prices hold above this level, it could suggest a temporary bottom, providing a buying opportunity. However, a failure to hold above this level might lead to further declines.
Conclusion
DoorDash, Inc. faces various challenges with its current downtrend, as indicated by technical analysis. However, due to its solid business model and continuous expansion, the company has substantial growth potential. Investors should carefully watch the retracement levels, as they might signal changes in momentum. A sustained break above 0.236 could initiate a recovery, while failure may lead to revisiting recent lows. As always, considering both the technical and fundamental aspects will provide a balanced view when making investment decisions.
Smart Data Insight
Master the Perfect Entry & Exit for this Stock
Don't leave your profits to chance. Historically, this stock follows specific seasonal patterns that institutional traders use to maximize returns.
- ✅ Identify the "Golden Buying Window"
- ✅ Avoid high-risk correction cycles
- ✅ Backtested data from the last 20+ years