November 10, 2025 a 05:15 am

DASH: Fibonacci Analysis - DoorDash, Inc.
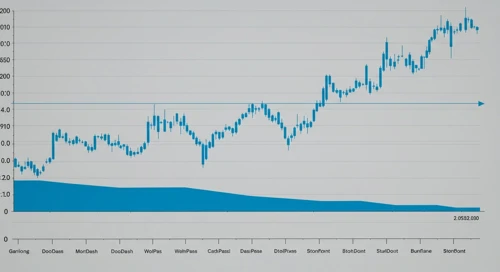
The recent analysis of DoorDash's stock suggests a predominantly downward trend across the observed time frame. As a key player in logistics and delivery, market dynamics and demand have shown a correlation with the stock's performance. Recent price actions provide an opportunity to utilize Fibonacci retracement to anticipate potential future levels of support and resistance. Observing the latest trend could present significant insights for traders looking to optimize their strategies around such critical price levels.
Fibonacci Analysis
| Parameter | Detail |
|---|---|
| Trend Start Date | 2025-08-07 |
| Trend End Date | 2025-11-07 |
| High Price | $270.99 on 2025-08-07 |
| Low Price | $182.96 on 2025-11-07 |
Fibonacci Retracement Levels
| Level | Price |
|---|---|
| 0.236 | $201.76 |
| 0.382 | $214.67 |
| 0.5 | $226.98 |
| 0.618 | $239.29 |
| 0.786 | $256.37 |
Current price is $204.31, placing it within the 0.236 retracement zone, suggesting a potential support level around this area.
Technically, this indicates possible stabilization or reversal at these levels, especially if market sentiment or fundamental factors provide additional support.
Conclusion
The DoorDash stock has experienced a significant downward trend, with technical analysis indicating it might currently be testing a key support level at the 0.236 Fibonacci retracement. The convergence of Fibonacci levels with recent price action highlights potential areas for traders to watch closely. Despite the bearish trend, this retracement provides a possible opportunity for reversal, or at least a deceleration in the bearish momentum. However, external market conditions and the company's performance must be factored into decision-making. For traders and analysts, maintaining vigilance at these levels could uncover valuable insights and opportunities.
Smart Data Insight
Master the Perfect Entry & Exit for this Stock
Don't leave your profits to chance. Historically, this stock follows specific seasonal patterns that institutional traders use to maximize returns.
- ✅ Identify the "Golden Buying Window"
- ✅ Avoid high-risk correction cycles
- ✅ Backtested data from the last 20+ years