September 29, 2025 a 03:07 pm


Currencies - Performance Analysis
Analyzing the recent performance of major currency pairs over short-term windows reveals noteworthy volatility and emerging trends. The U.S. Dollar demonstrates strength against several currencies, reflecting geopolitical and macroeconomic factors. Key performances indicate potential trading opportunities and risk considerations for investors.
📊 Currencies Performance One Week
| Currency | Performance (%) | Performance |
|---|---|---|
| USD/JPY | 1.15 | |
| USD/CAD | 0.81 | |
| USD/CHF | 0.37 | |
| AUD/USD | -0.68 | |
| GBP/USD | -0.71 | |
| EUR/USD | -0.83 | |
| NZD/USD | -1.48 |
🗣️ Currencies Performance One Month
| Currency | Performance (%) | Performance |
|---|---|---|
| USD/JPY | 1.62 | |
| USD/CAD | 1.39 | |
| AUD/USD | 0.29 | |
| EUR/USD | 0.18 | |
| USD/CHF | -0.60 | |
| GBP/USD | -0.64 | |
| NZD/USD | -1.87 |
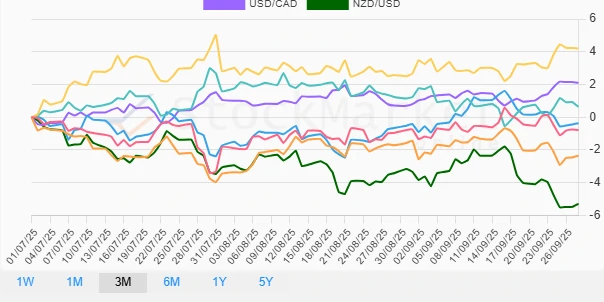
🔍 Currencies Performance Three Months
| Currency | Performance (%) | Performance |
|---|---|---|
| USD/JPY | 4.20 | |
| USD/CAD | 2.10 | |
| USD/CHF | 0.64 | |
| AUD/USD | -0.37 | |
| EUR/USD | -0.78 | |
| GBP/USD | -2.36 | |
| NZD/USD | -5.29 |
✅ Summary
Overall, the analysis of currency performance over the specified time frames indicates significant volatility driven by economic and political factors. The USD/JPY emerges as a consistent top performer, suggesting underlying strength in the U.S. Dollar against the Yen, possibly due to interest rate differentials and economic performance. Conversely, the NZD/USD shows persistent weakness, approximating underperformance across all time horizons, driven by domestic challenges and external trade dynamics. Investors should consider these trends when positioning within forex markets, balancing potential returns against inherent risks in volatile currency environments.
Smart Data Insight
Master the Perfect Entry & Exit for this Stock
Don't leave your profits to chance. Historically, this stock follows specific seasonal patterns that institutional traders use to maximize returns.
- ✅ Identify the "Golden Buying Window"
- ✅ Avoid high-risk correction cycles
- ✅ Backtested data from the last 20+ years