November 24, 2025 a 03:07 pm


Currencies - Performance Analysis
In a rapidly shifting macroeconomic landscape, currency performances are at the forefront of market analysis. Over this report, we delve into the weekly, monthly, and quarterly movements of key currency pairs, unveiling top performative trends and identifying underperformers. These insights aim to provide clarity and guidance for strategic trading positions.
Currencies Performance One Week 📊
| Currency | Performance (%) | Performance |
|---|---|---|
| USD/CHF | 1.62 | |
| USD/JPY | 0.97 | |
| USD/CAD | 0.33 | |
| GBP/USD | -0.48 | |
| AUD/USD | -0.60 | |
| EUR/USD | -0.74 | |
| NZD/USD | -0.89 |
Currencies Performance One Month 📊
| Currency | Performance (%) | Performance |
|---|---|---|
| USD/JPY | 2.47 | |
| USD/CHF | 1.82 | |
| USD/CAD | 0.79 | |
| AUD/USD | -0.95 | |
| EUR/USD | -1.01 | |
| GBP/USD | -1.70 | |
| NZD/USD | -2.43 |
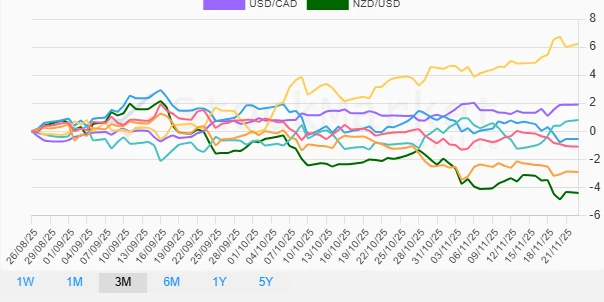
Currencies Performance Three Months 📊
| Currency | Performance (%) | Performance |
|---|---|---|
| USD/JPY | 6.24 | |
| USD/CAD | 1.91 | |
| USD/CHF | 0.80 | |
| AUD/USD | -0.56 | |
| EUR/USD | -1.10 | |
| GBP/USD | -2.92 | |
| NZD/USD | -4.40 |
Summary 📈
The currency performance analysis across the three periods reveals notable trends with USD/JPY consistently leading as the top performer, illustrating robust appreciation. Conversely, NZD/USD maintained a declining trajectory across all timelines, identifying it as a significant underperformer. The data indicates sustained strength in the US Dollar against most major currencies, which could persist given the current macroeconomic indicators. Financial strategists should weigh potential USD positions for continued strength while remaining cautious with NZD exposures due to prevailing weakness.
Smart Data Insight
Master the Perfect Entry & Exit for this Stock
Don't leave your profits to chance. Historically, this stock follows specific seasonal patterns that institutional traders use to maximize returns.
- ✅ Identify the "Golden Buying Window"
- ✅ Avoid high-risk correction cycles
- ✅ Backtested data from the last 20+ years